Click on each image to see an enlarged version of it.
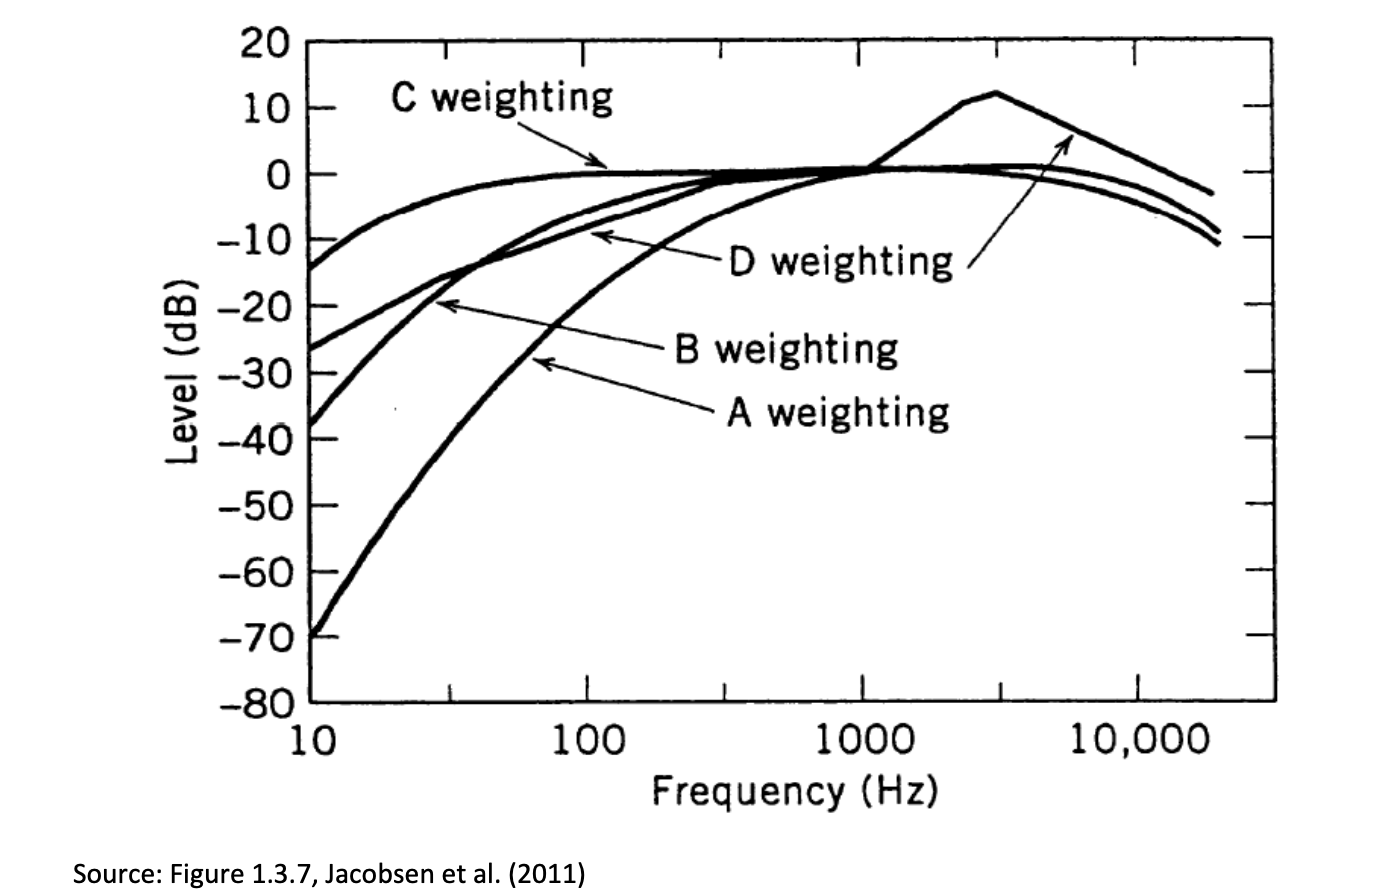
One of the challenges of infrasound assessment is that the pressure waveforms recorded by devices like the Raspberry Shake & Boom need to be converted in to Sound Pressure levels (SPL) measured on the logarithmic dB scale. There are various types of weighting used for such conversions, the most common being the db(A) weighting scale – see the chart of commonly-used SPL weightings in the margin.
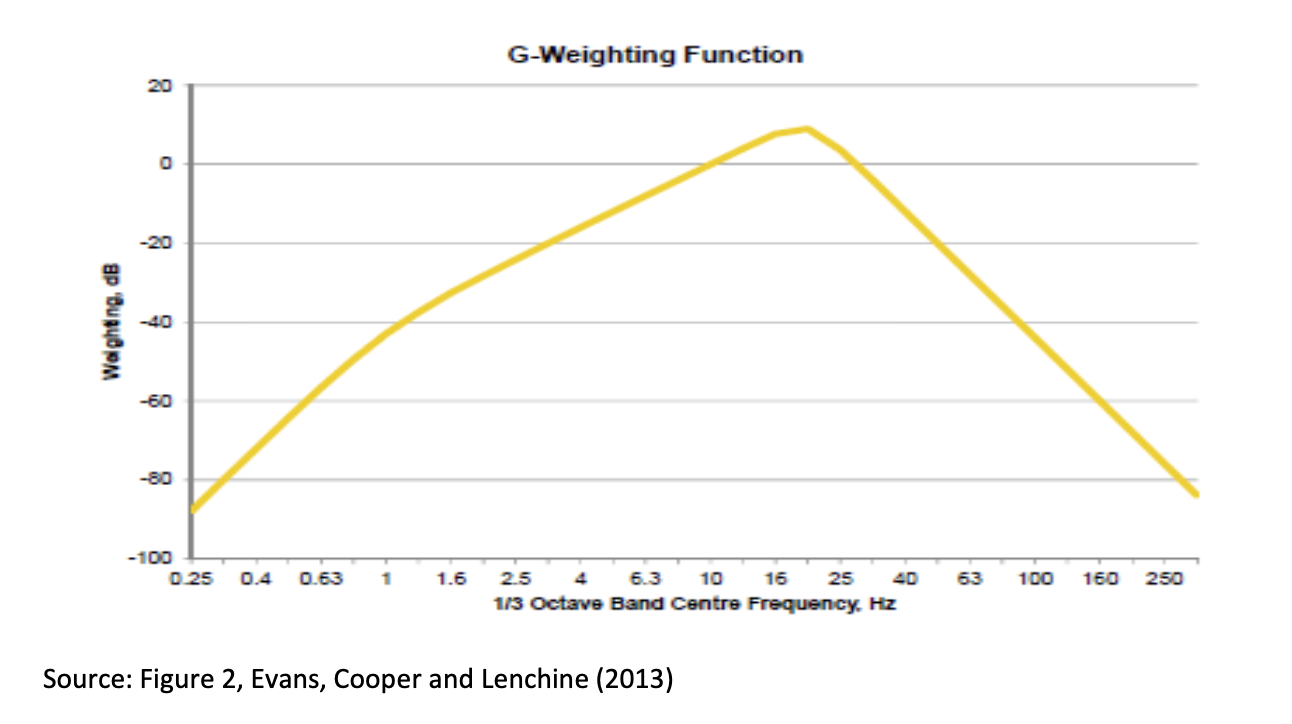
However, infrasound requires a quite different weighting to mimic the sensitivity of the human ear (and body, as infrasound at high levels can be felt as well as heard). This is called the G weighting scale, and looks like this:
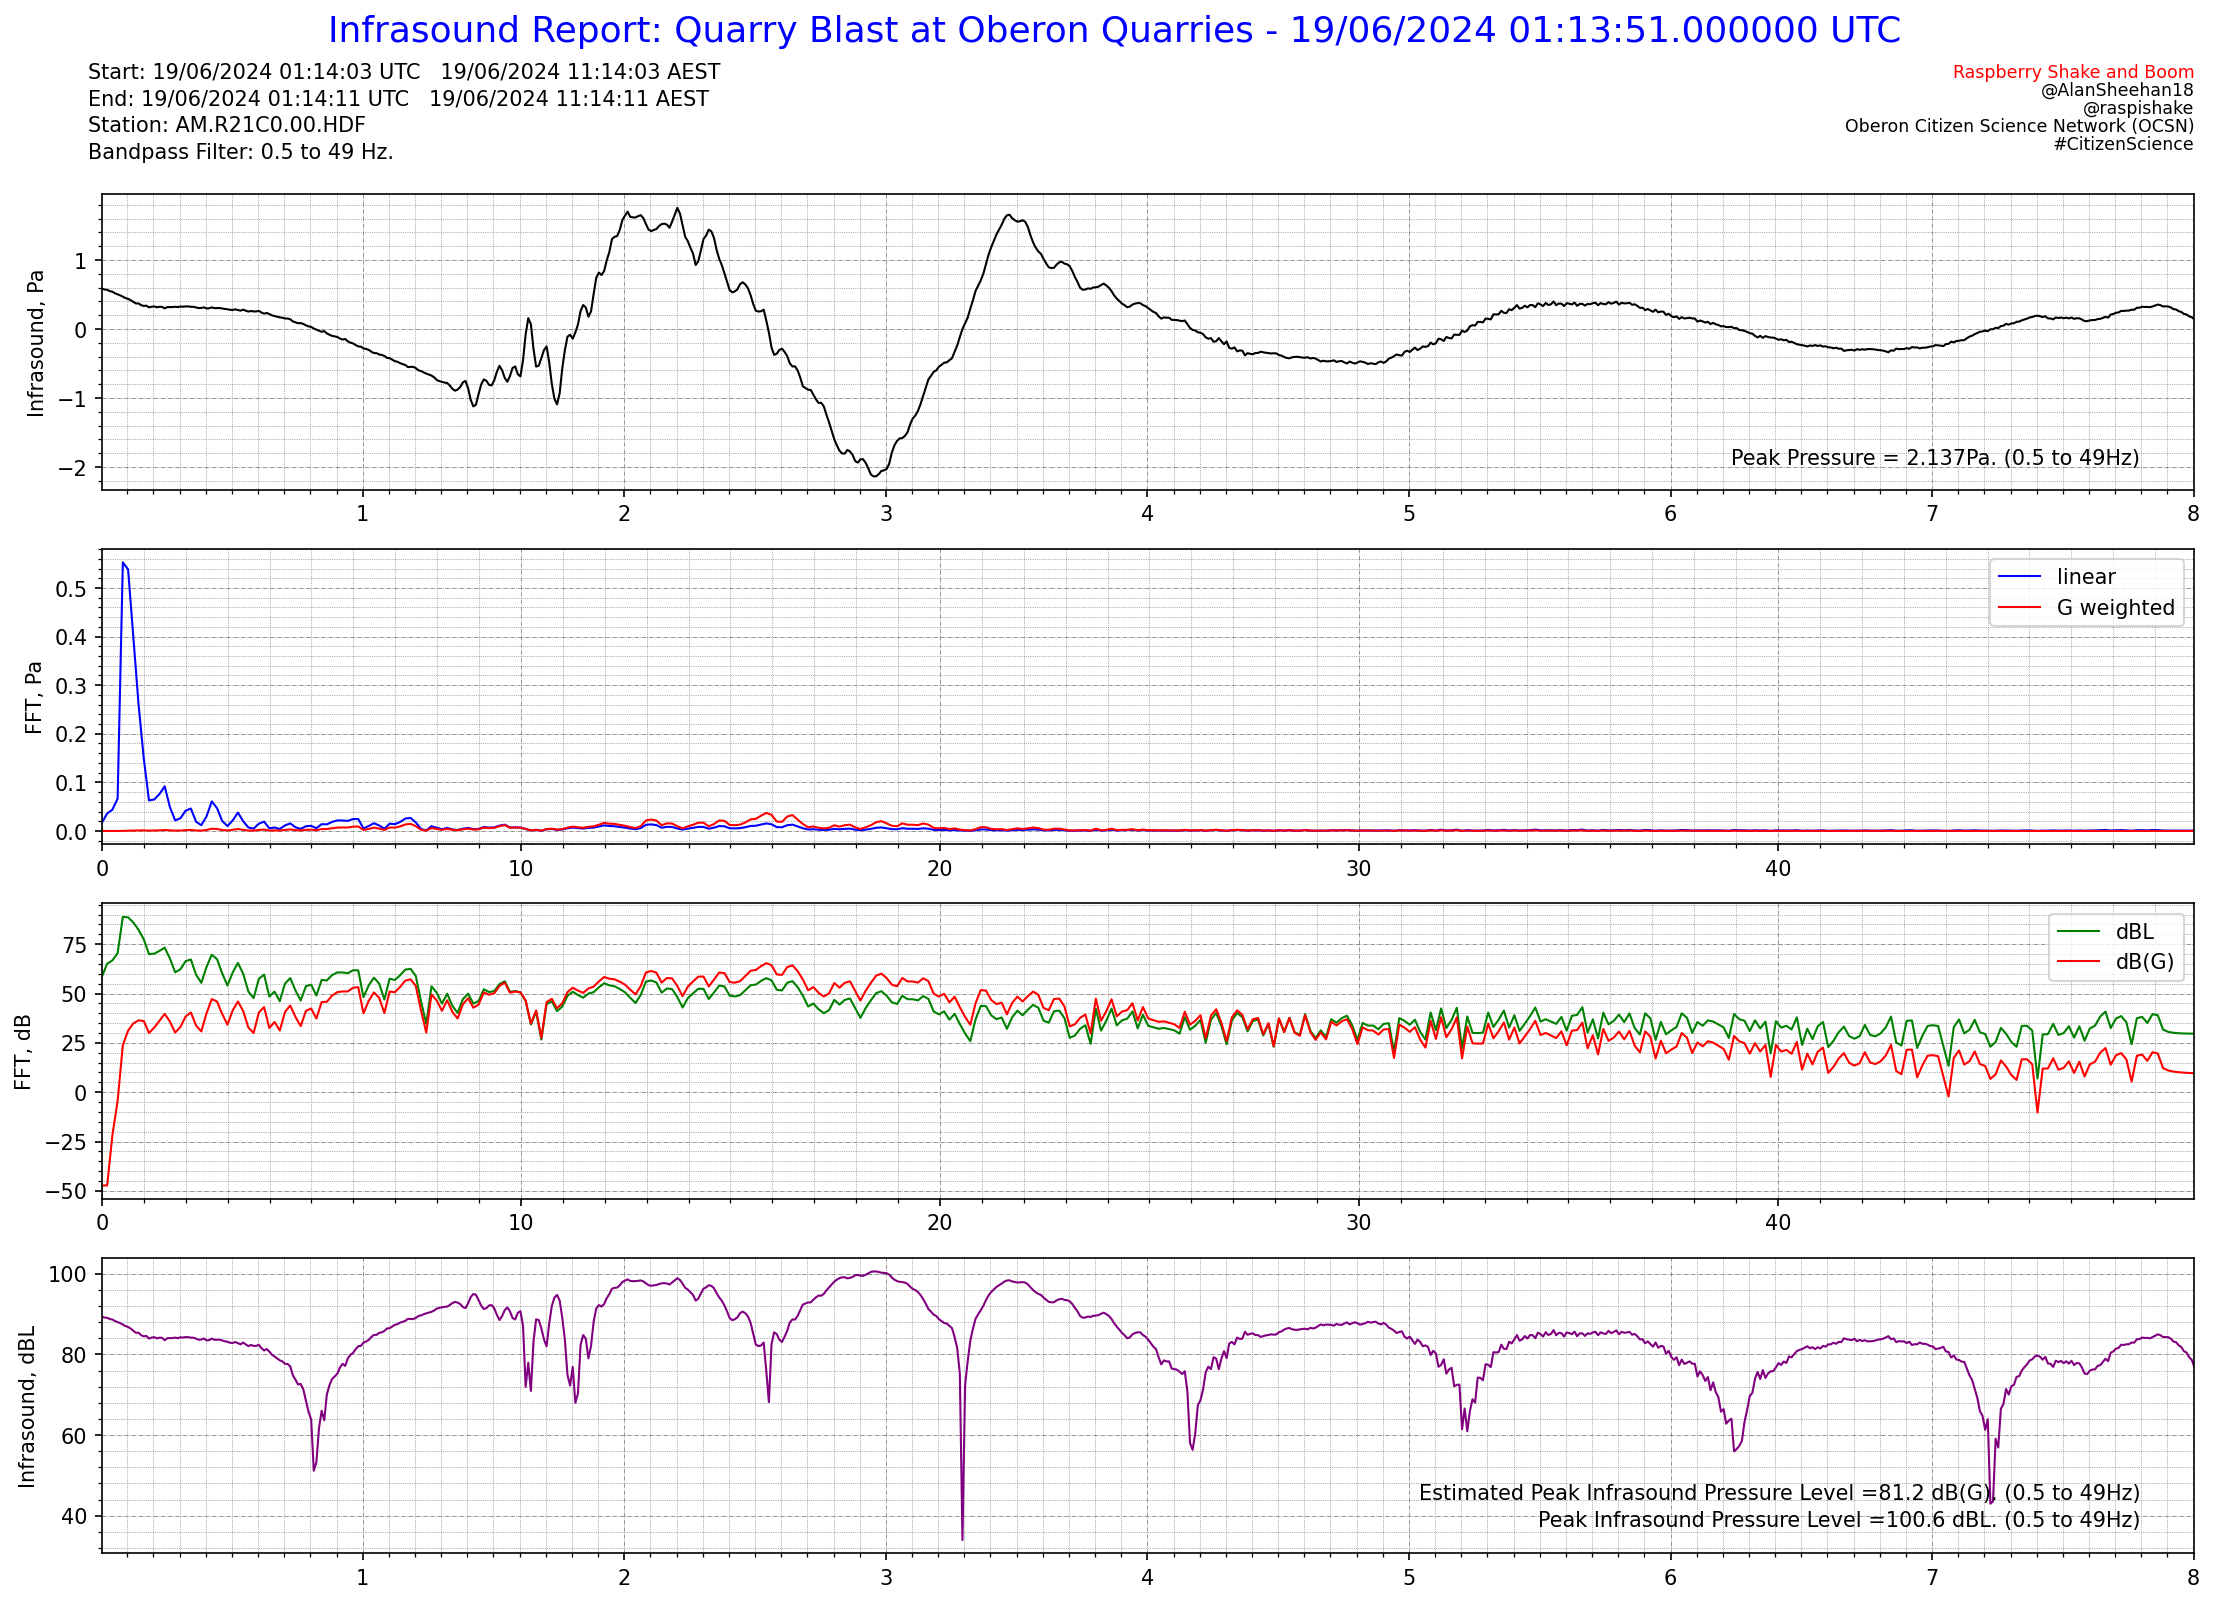
Software to carry out this weighting is not very common. However, after a bit of thought, a simple mechanism to achieve G weighting measurements has been found which does not require any high-level maths to understand. The idea is to create a fast Fourier transform (FFT) in dB(L) of the raw data, then apply the G weighting function to produce an FFT in dB(G).
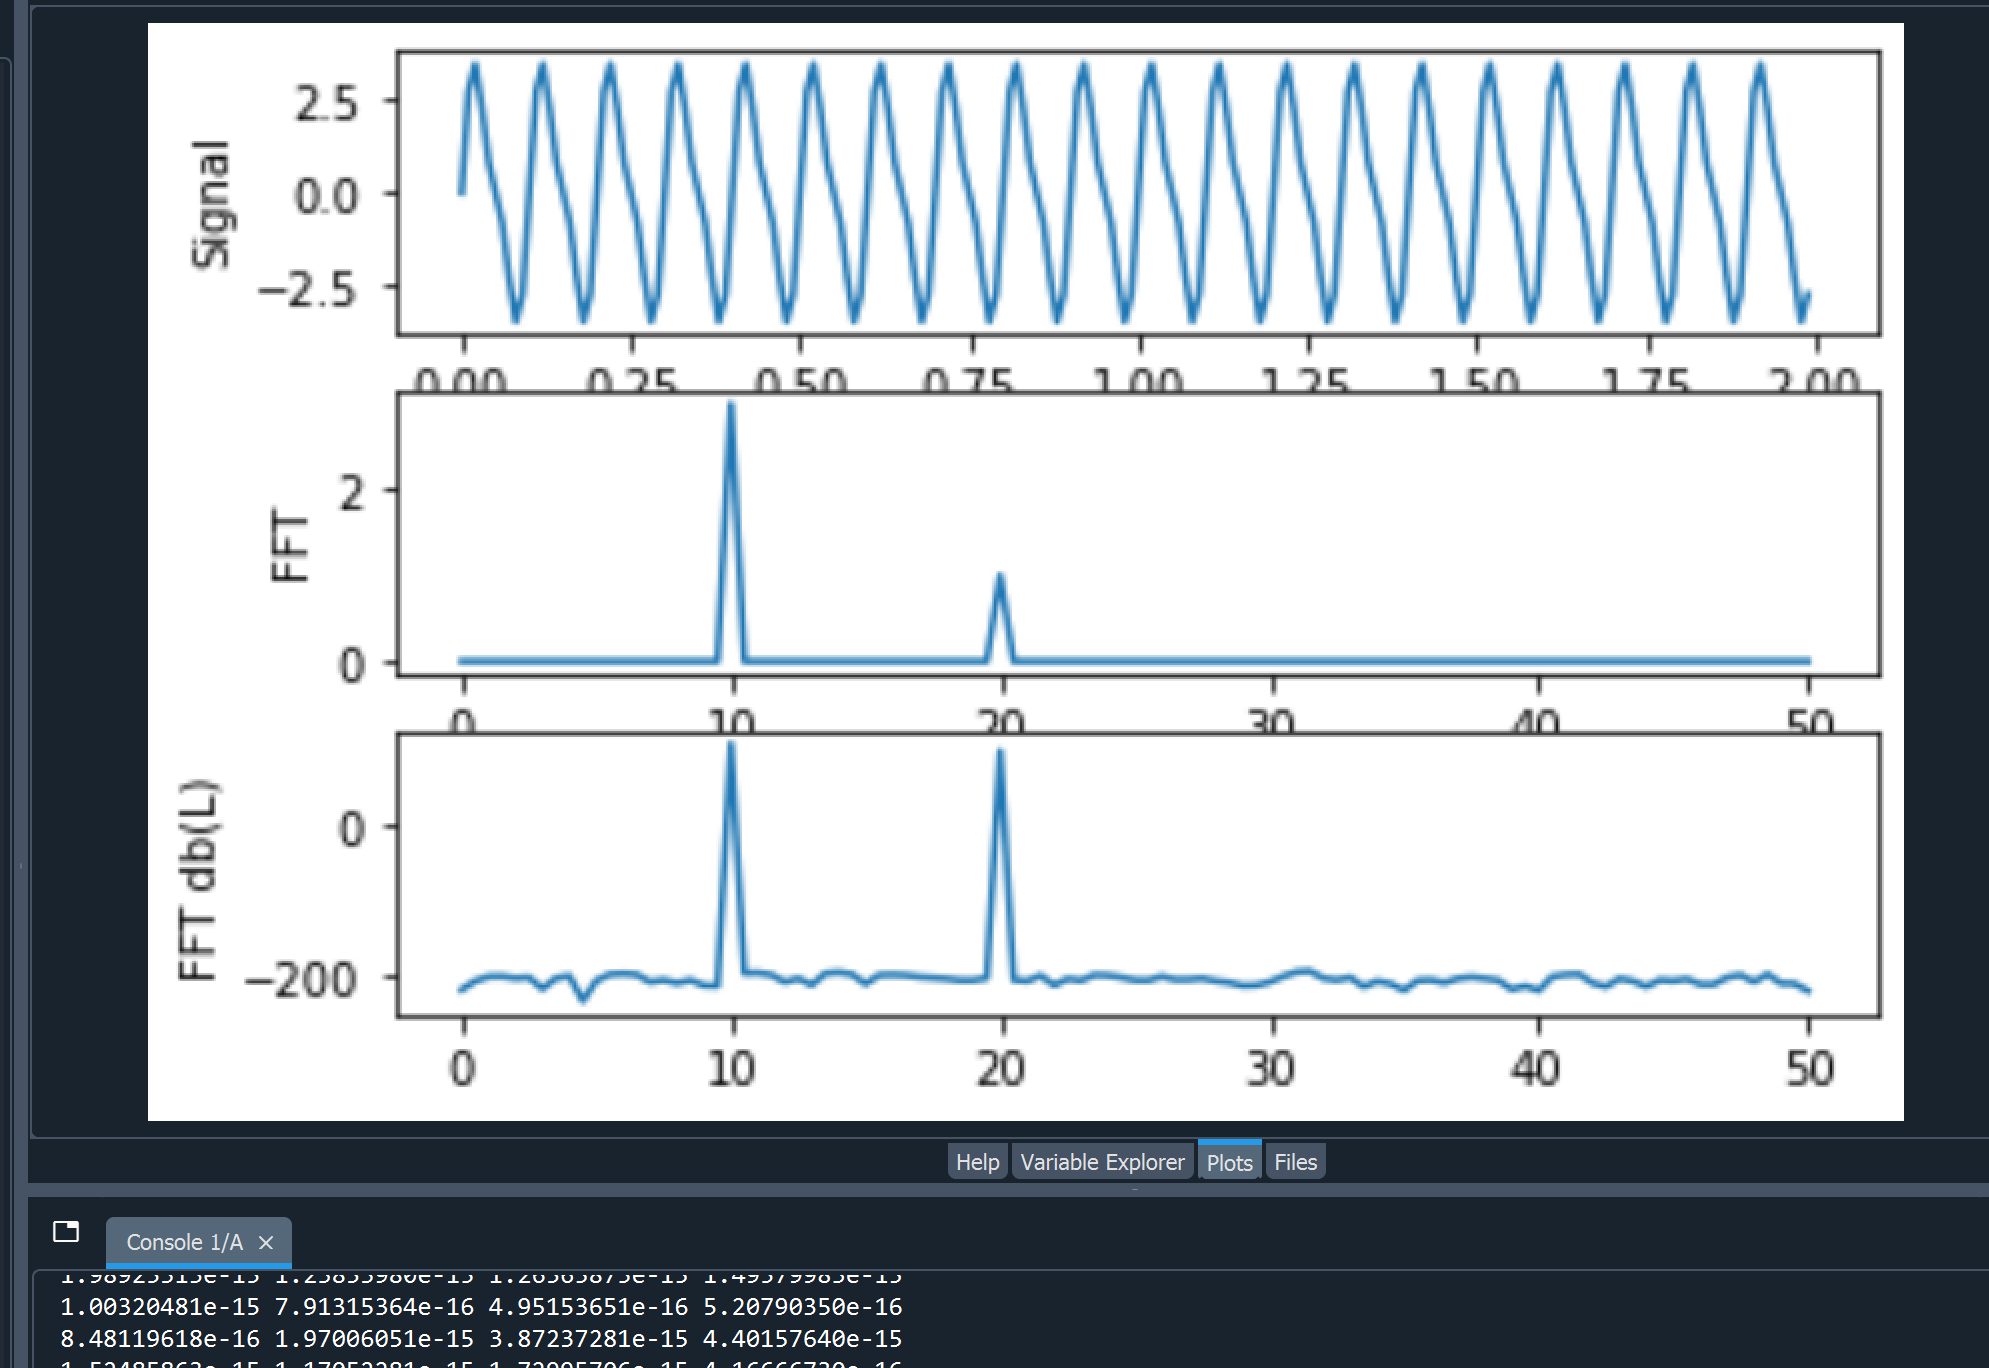
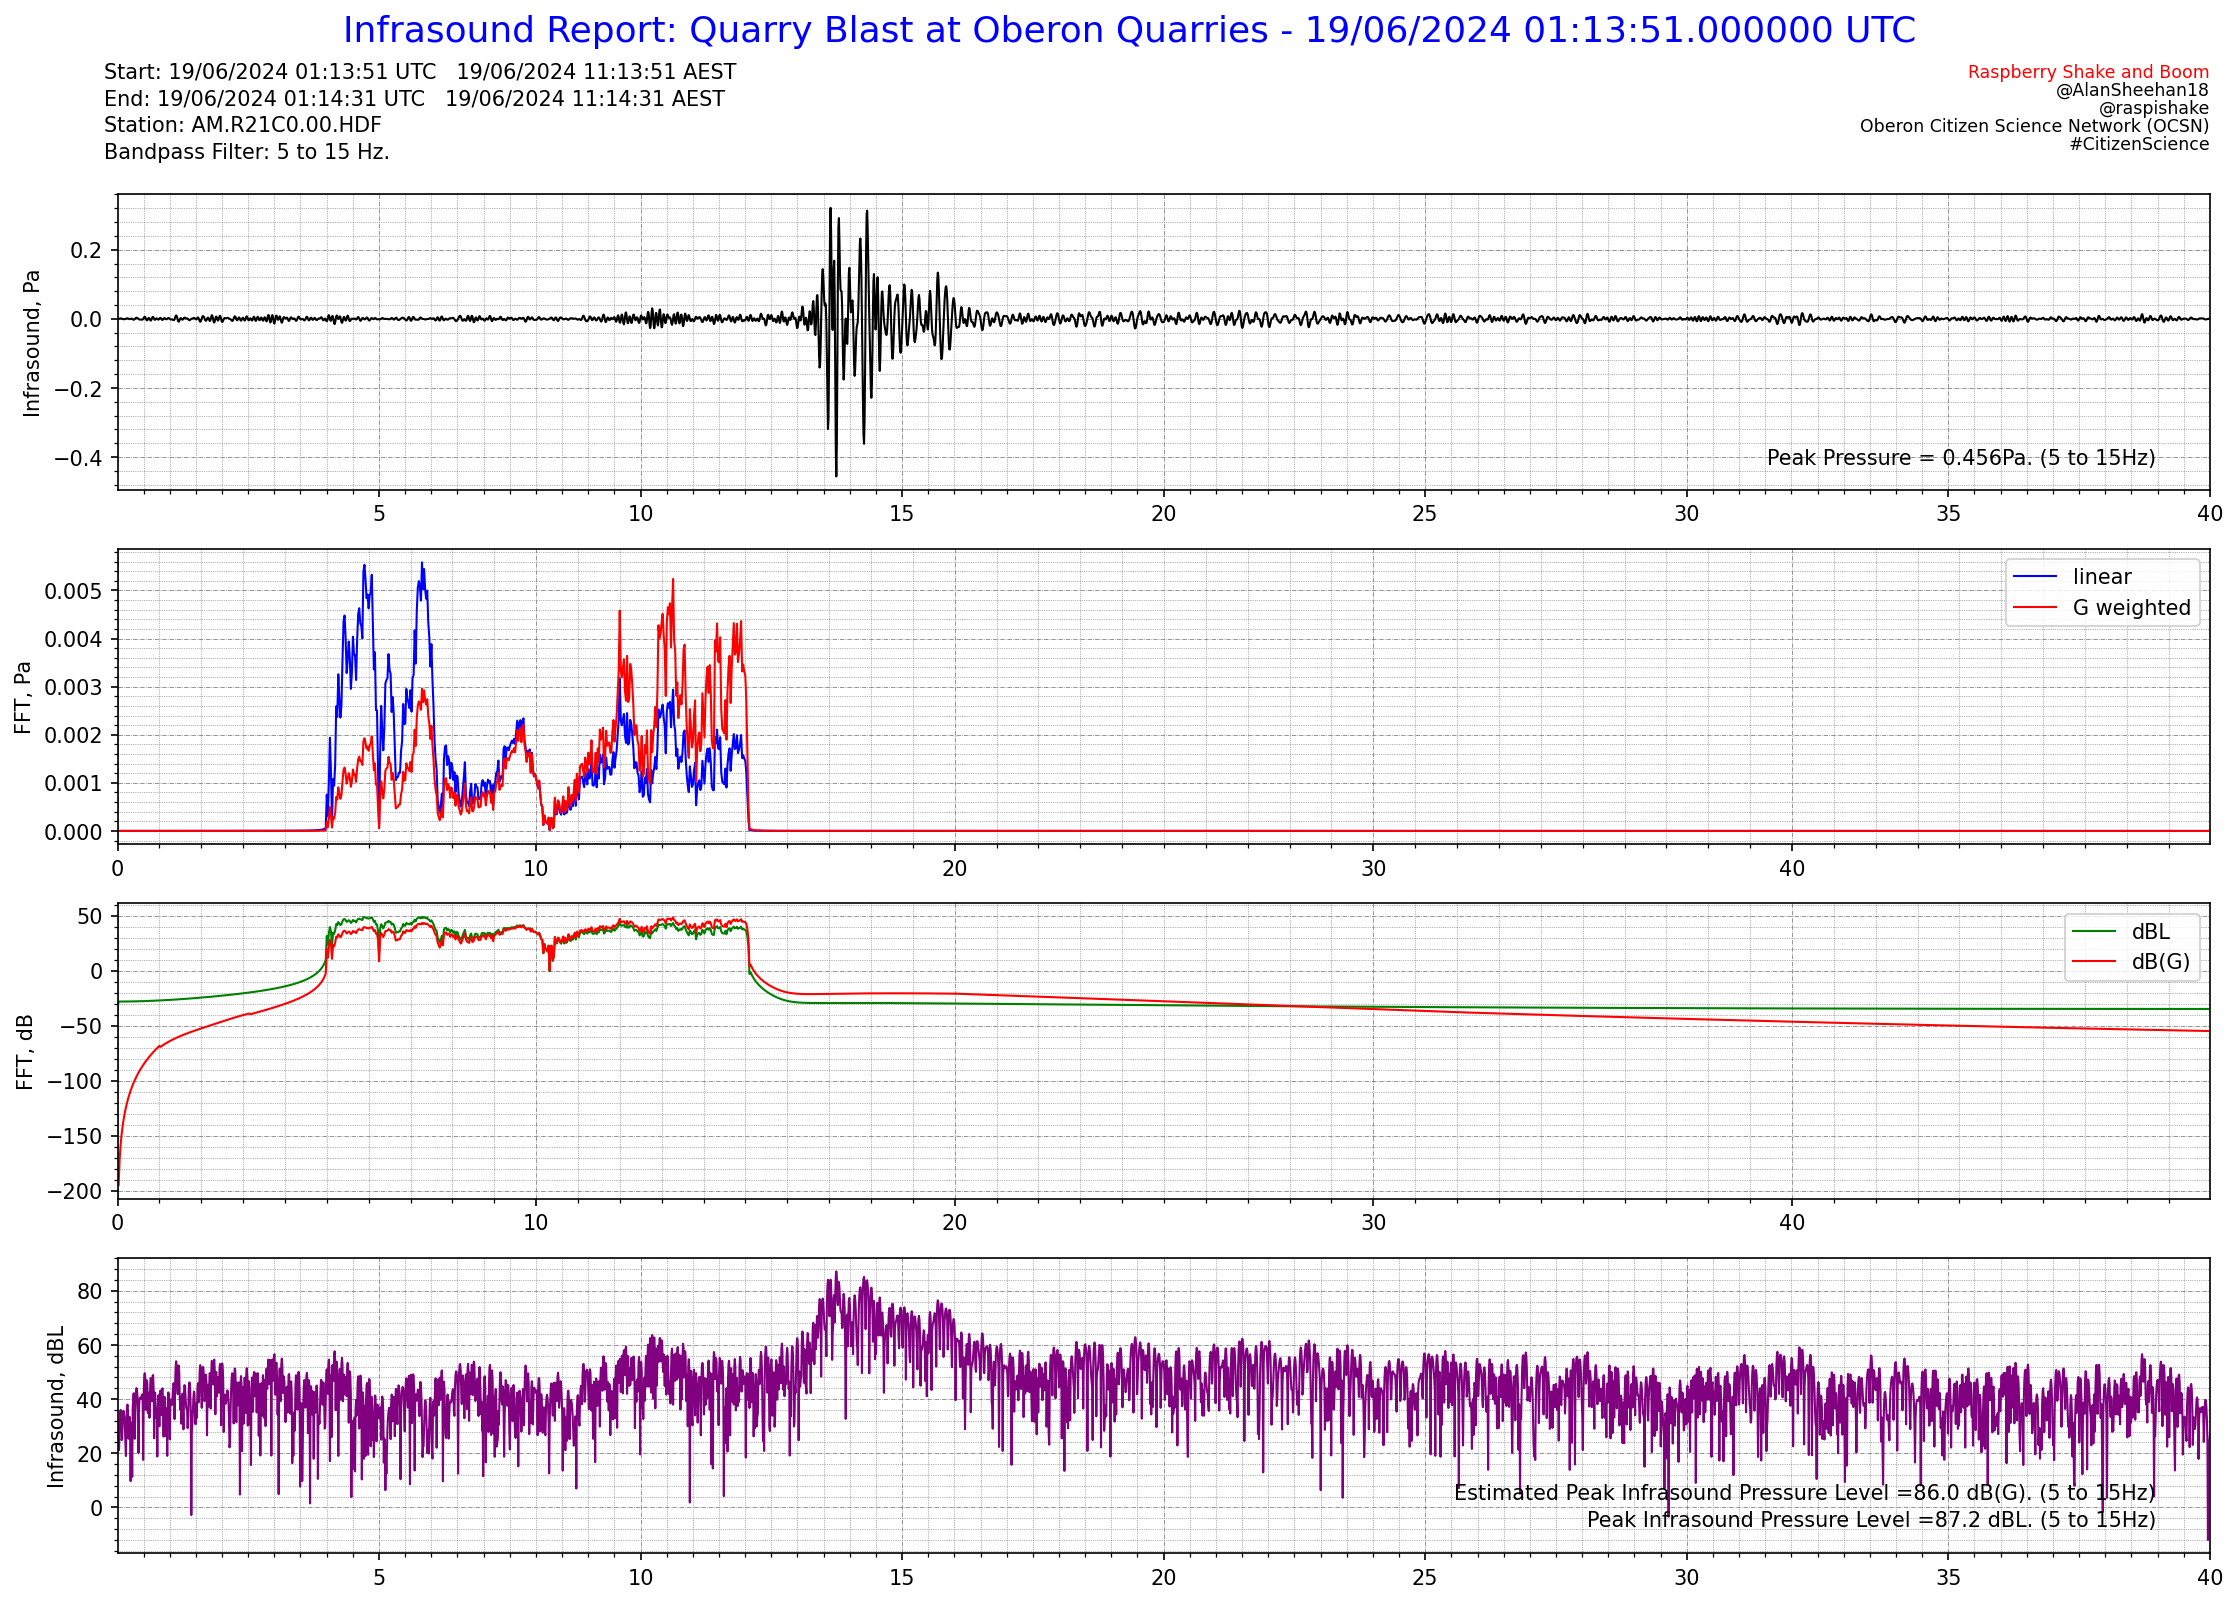
First I made sure the FFT in Pa was correctly normalised so it represents Pa. That is converted to dB(L), the G weighting is applied to the dB(L) to get dB(G). I’ve then converted the dB(G) back to Pa as an FFT (red plot in second axes). Now when I sum the FFTs I get a pressure in Pa which does not relate to levels in the signal unfortunately, but I am thinking the difference between these two summed pressures when convert back to dB is the difference overall between dB(L) and dB(G). It’s basically assuming the same frequency distribution across the whole sample period, which I think is the best we can hope to do without a real-time weighting circuit behind the microphone as the real SPL meters do. The estimated peak dB(G) is in the bottom right corner just above the peak dB(L). My tests show it works well in narrow band around 10Hz where dB(L) and dB(G) are the same. At this stage I can’t see any reason why there’d need to be another scaling factor in there.

Postscript
I’ve cracked the dB(G) estimating! I have just averaged the difference between the dB(L) and dB(G) curves for the bandpass filter range only. Over thought the first solution!
Post-Postscript
After much deliberation, coding and testing, this project is maturing and looking promising. In the process the code has been developed into a Python module, so it can be used by multiple programs and scripts without retyping or copying the important parts of the code.
In the end, the final method chosen to apply the G weighting back to the time domain signal was to apply either an octave or 1/3 octave series of filters to the signal and use the maximum linear FFT value and the corresponding value in the G weighted FFT to scale the linear waveforms to G weighting. This solution was selected after it was realised the previous average of the difference would not work with a tonal signal. A signal at a single frequency has a lot of zero frequencies in the FFT and these need to be ignored when scaling the waveforms.
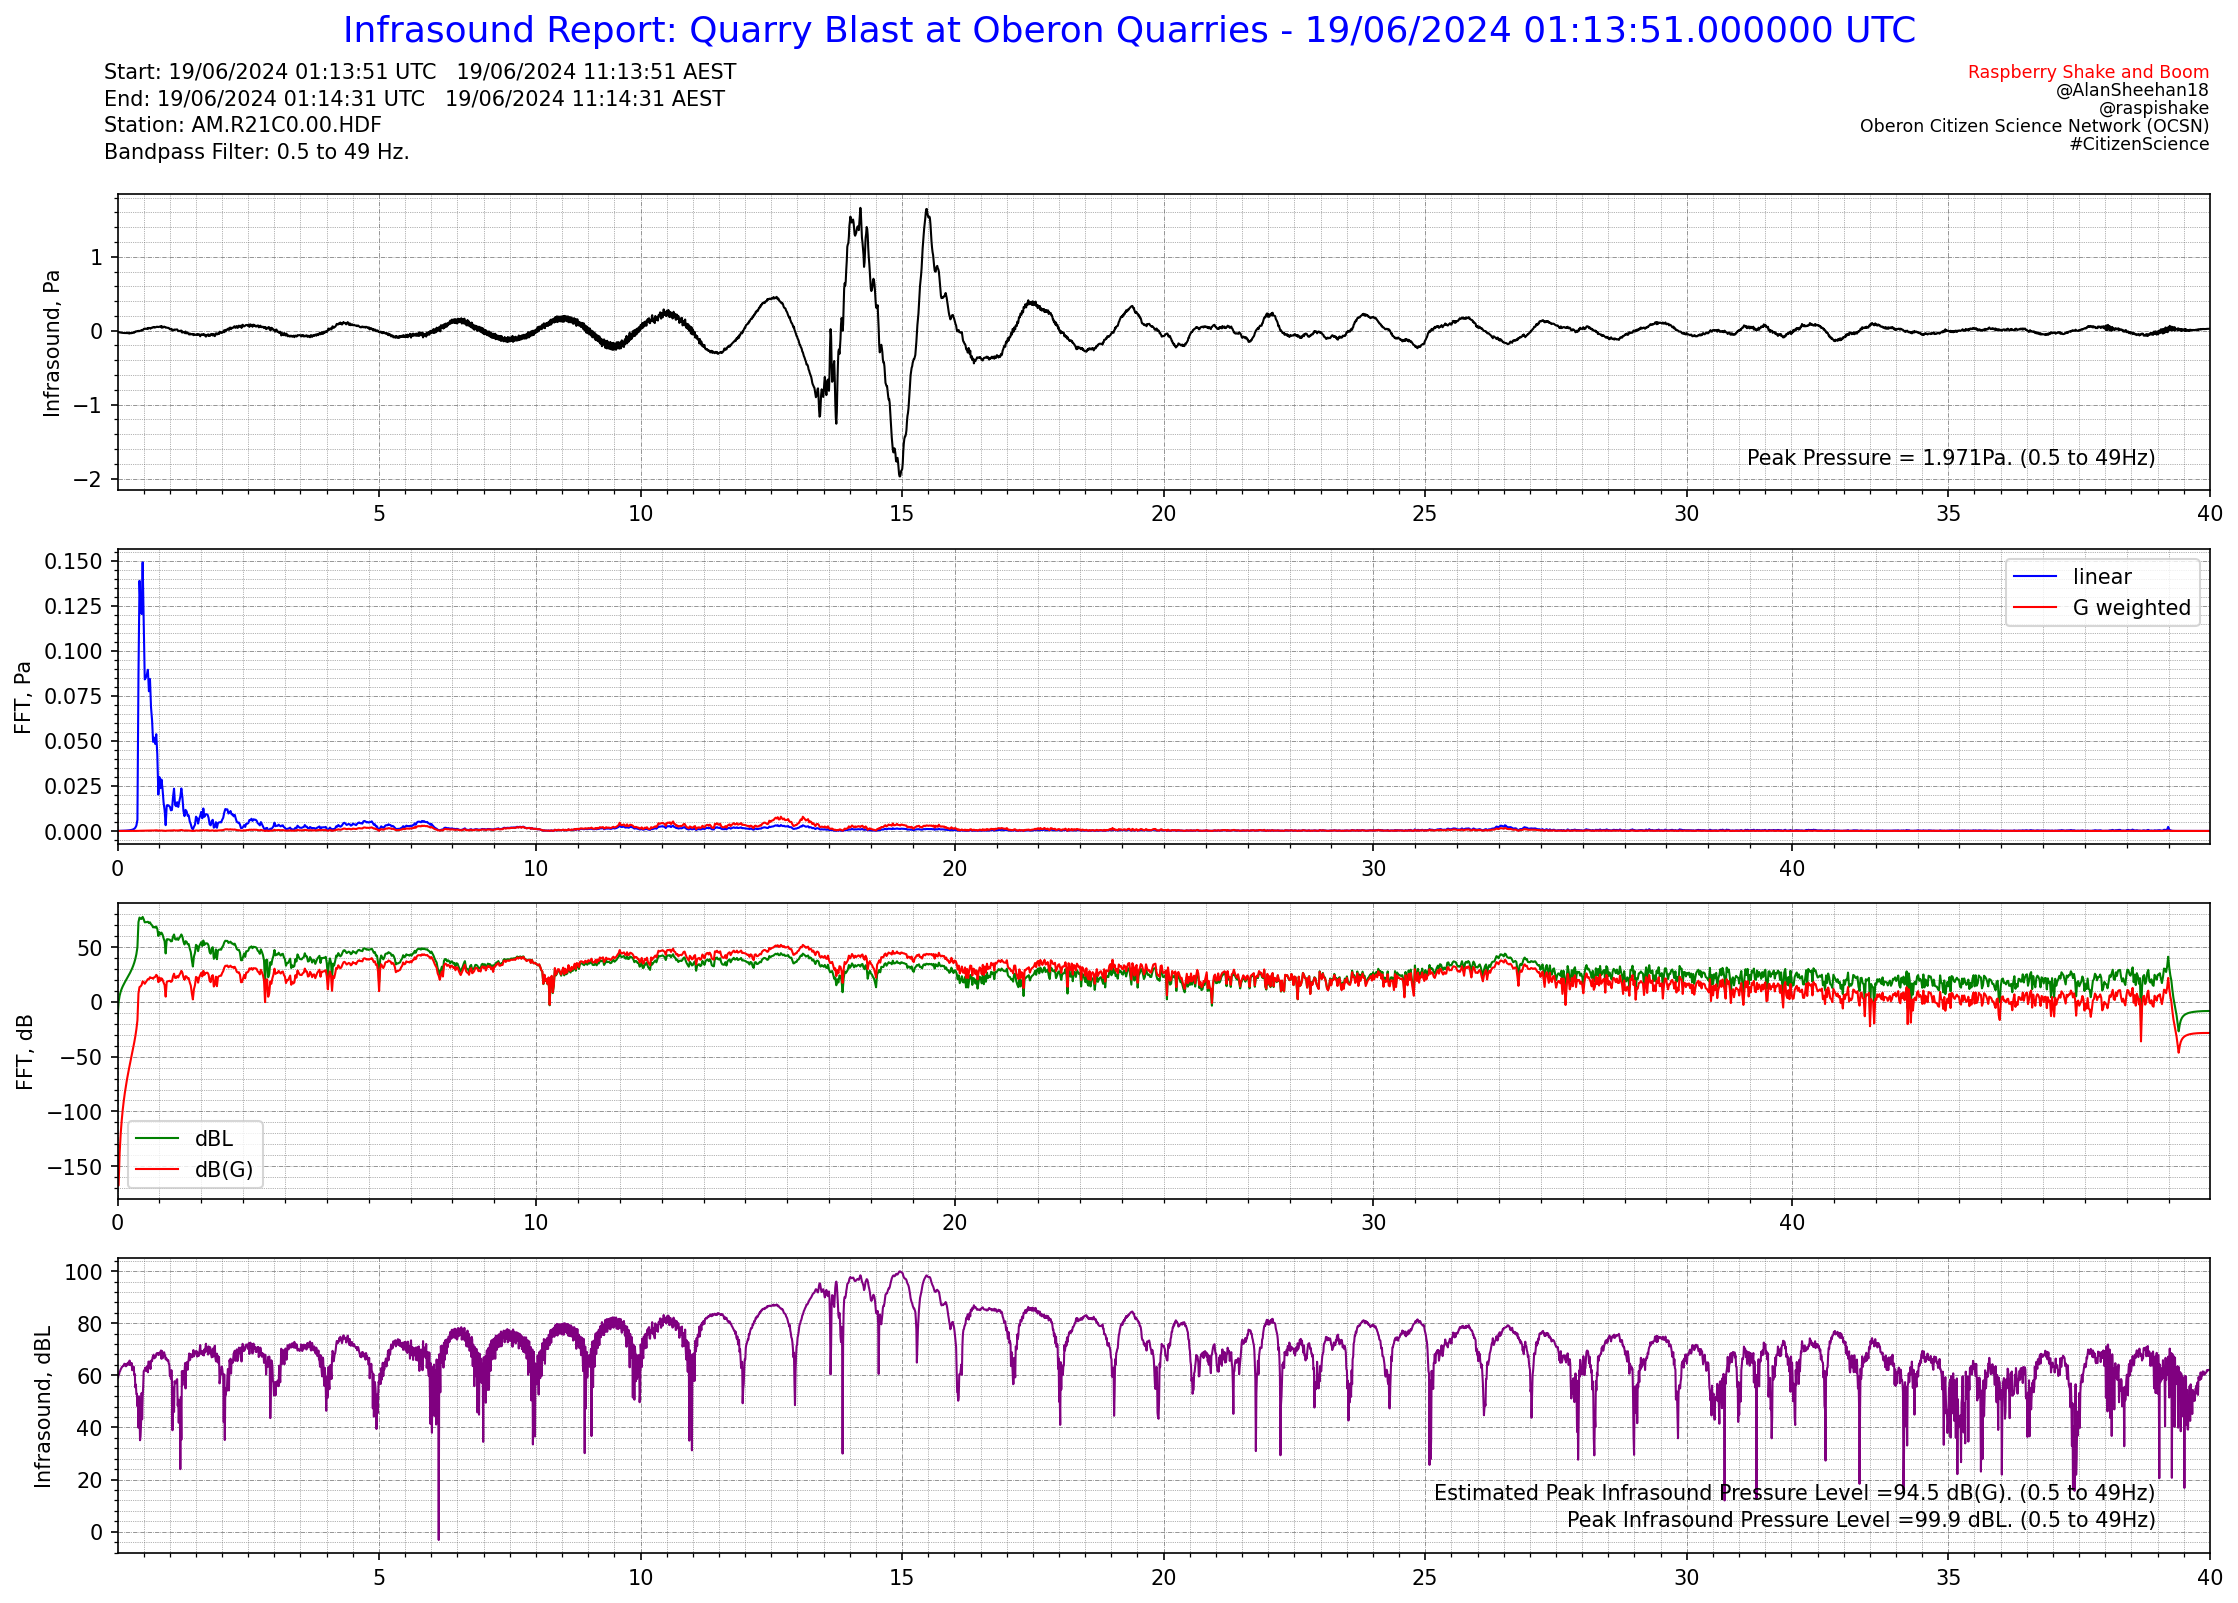
The current state of play with output from this package is shown in the reports below. There is a lot of information included in these reports which could of course be expanded into reports of their own, such as Octave Analysis, 1/3 Octave Analysis, etc. There is probably a need to add additional functionality into the module in future for things like Leq (averaged infrasound pressure level over a time period) but for now the module only handles instantaneous infrasound pressure levels. It is not anticipated that Leq functionality will be as challenging as the G weighting and octave and 1/3 octave band analysis functionality.
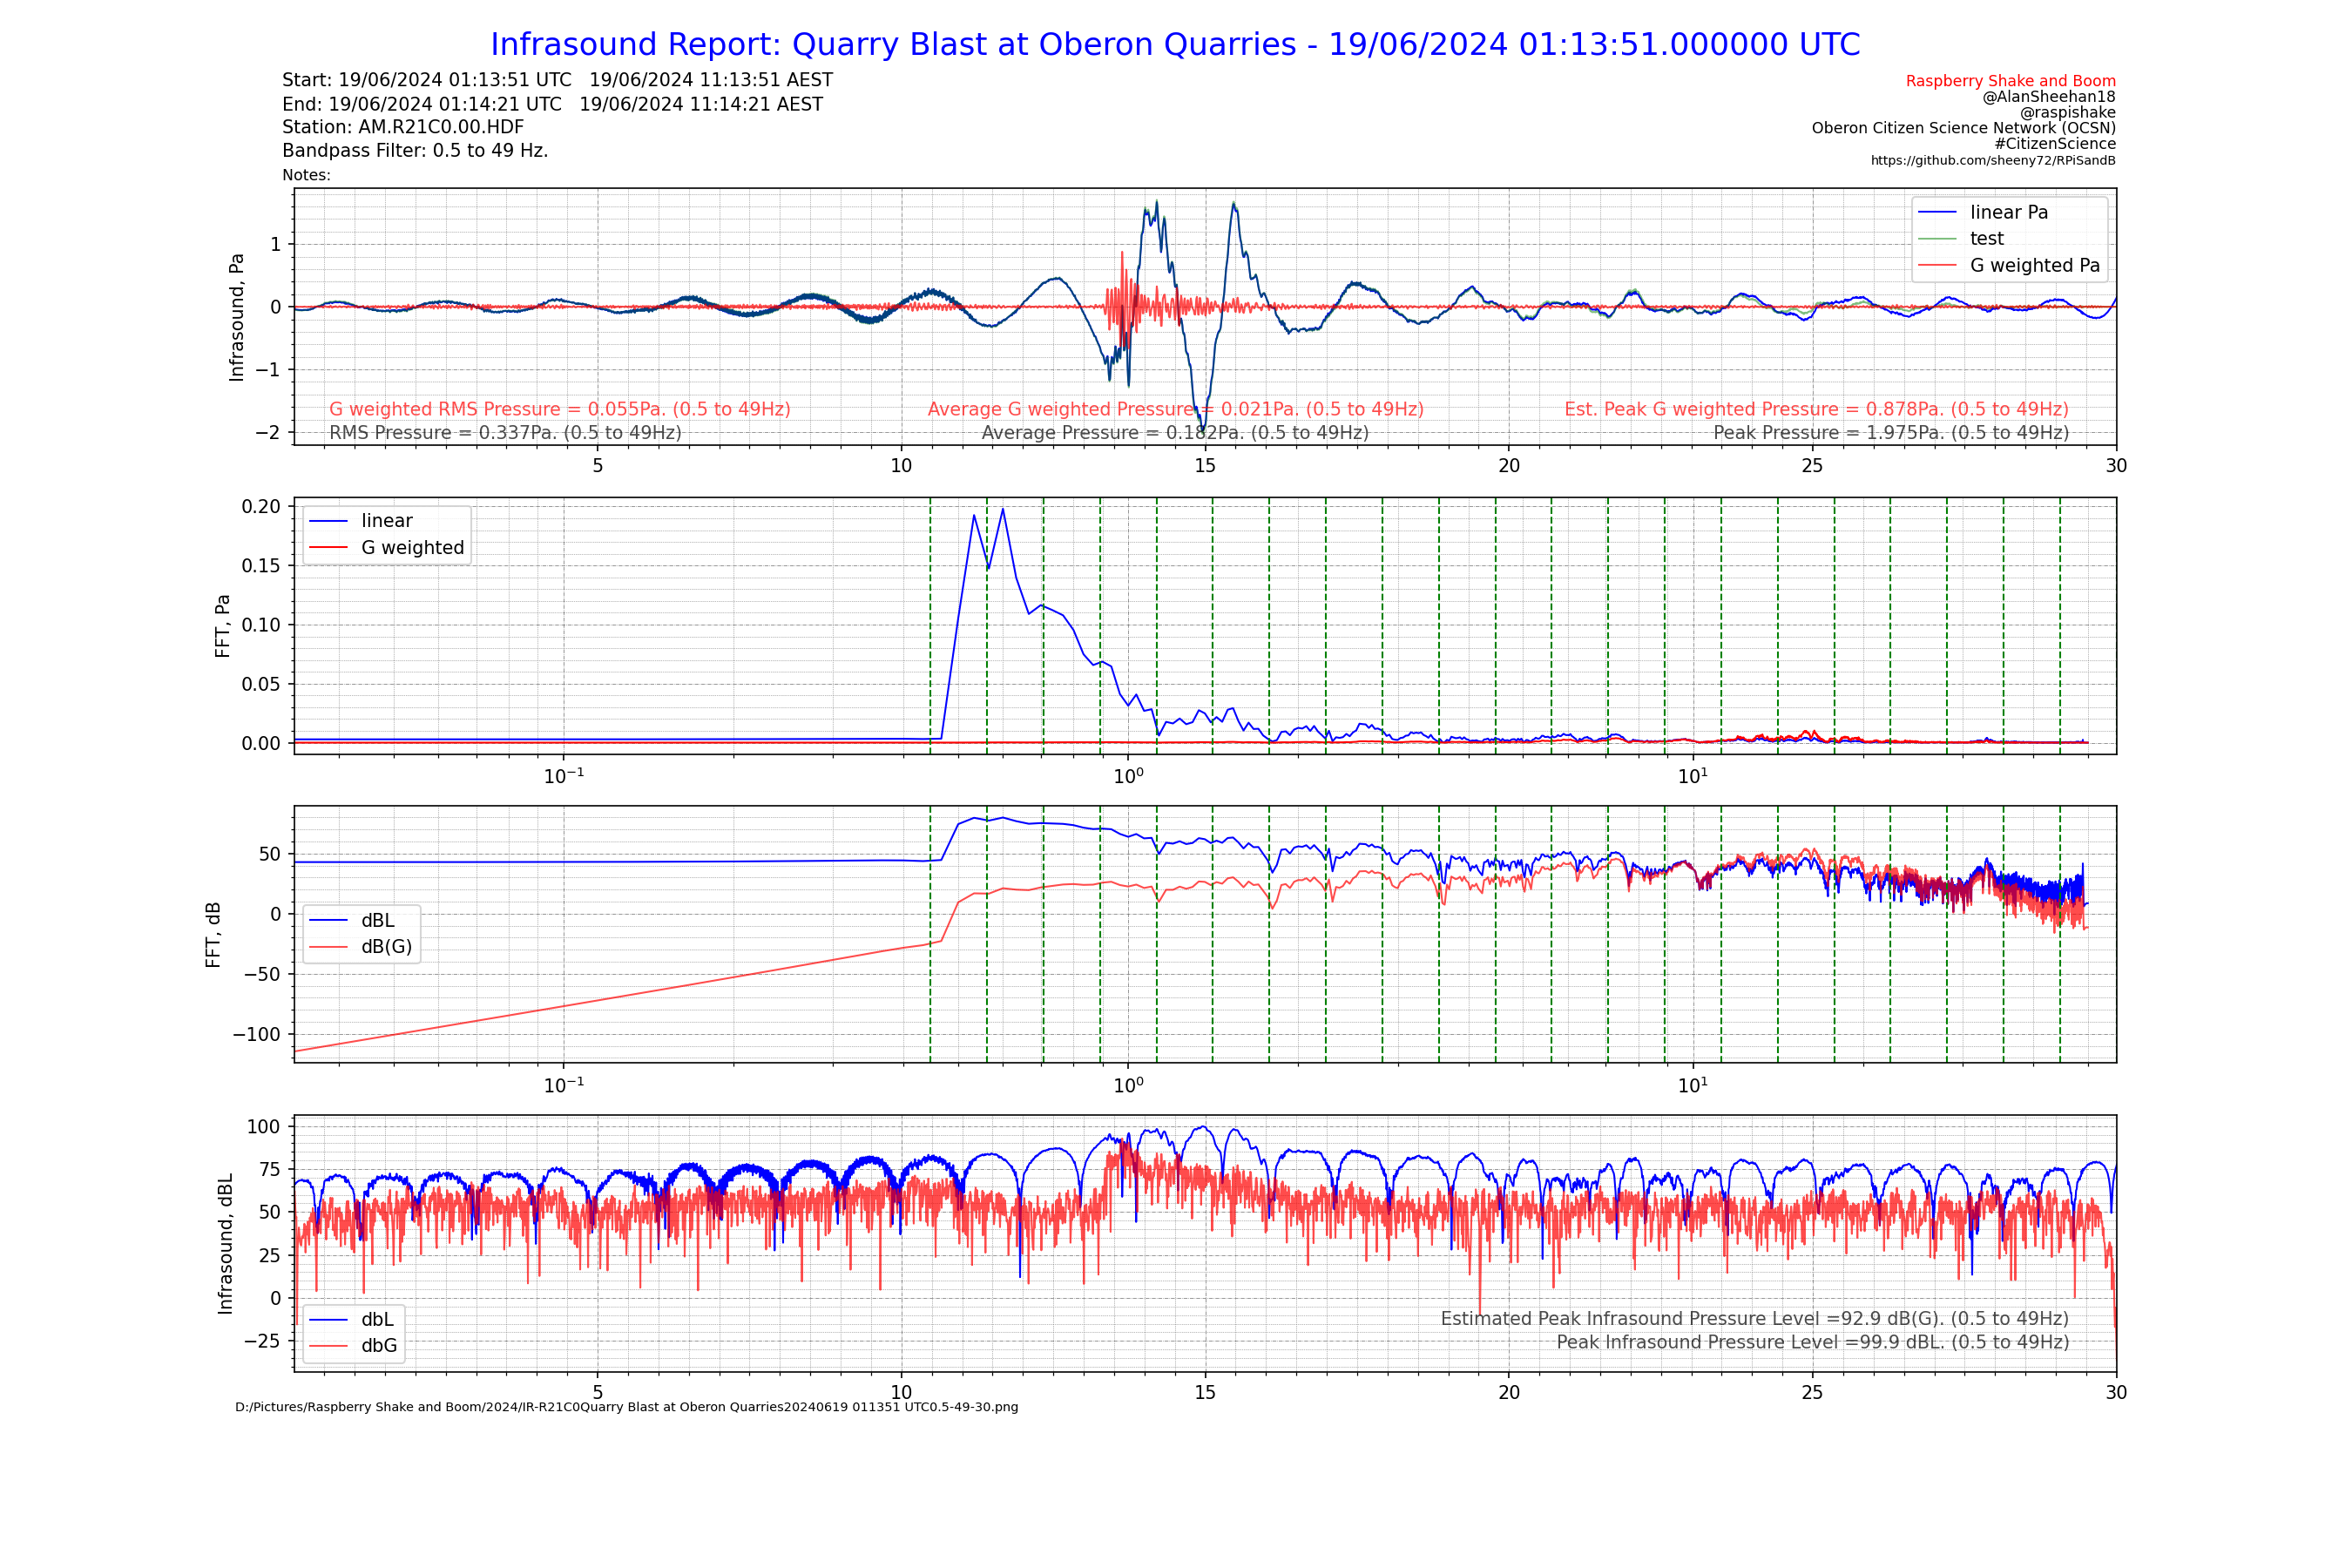
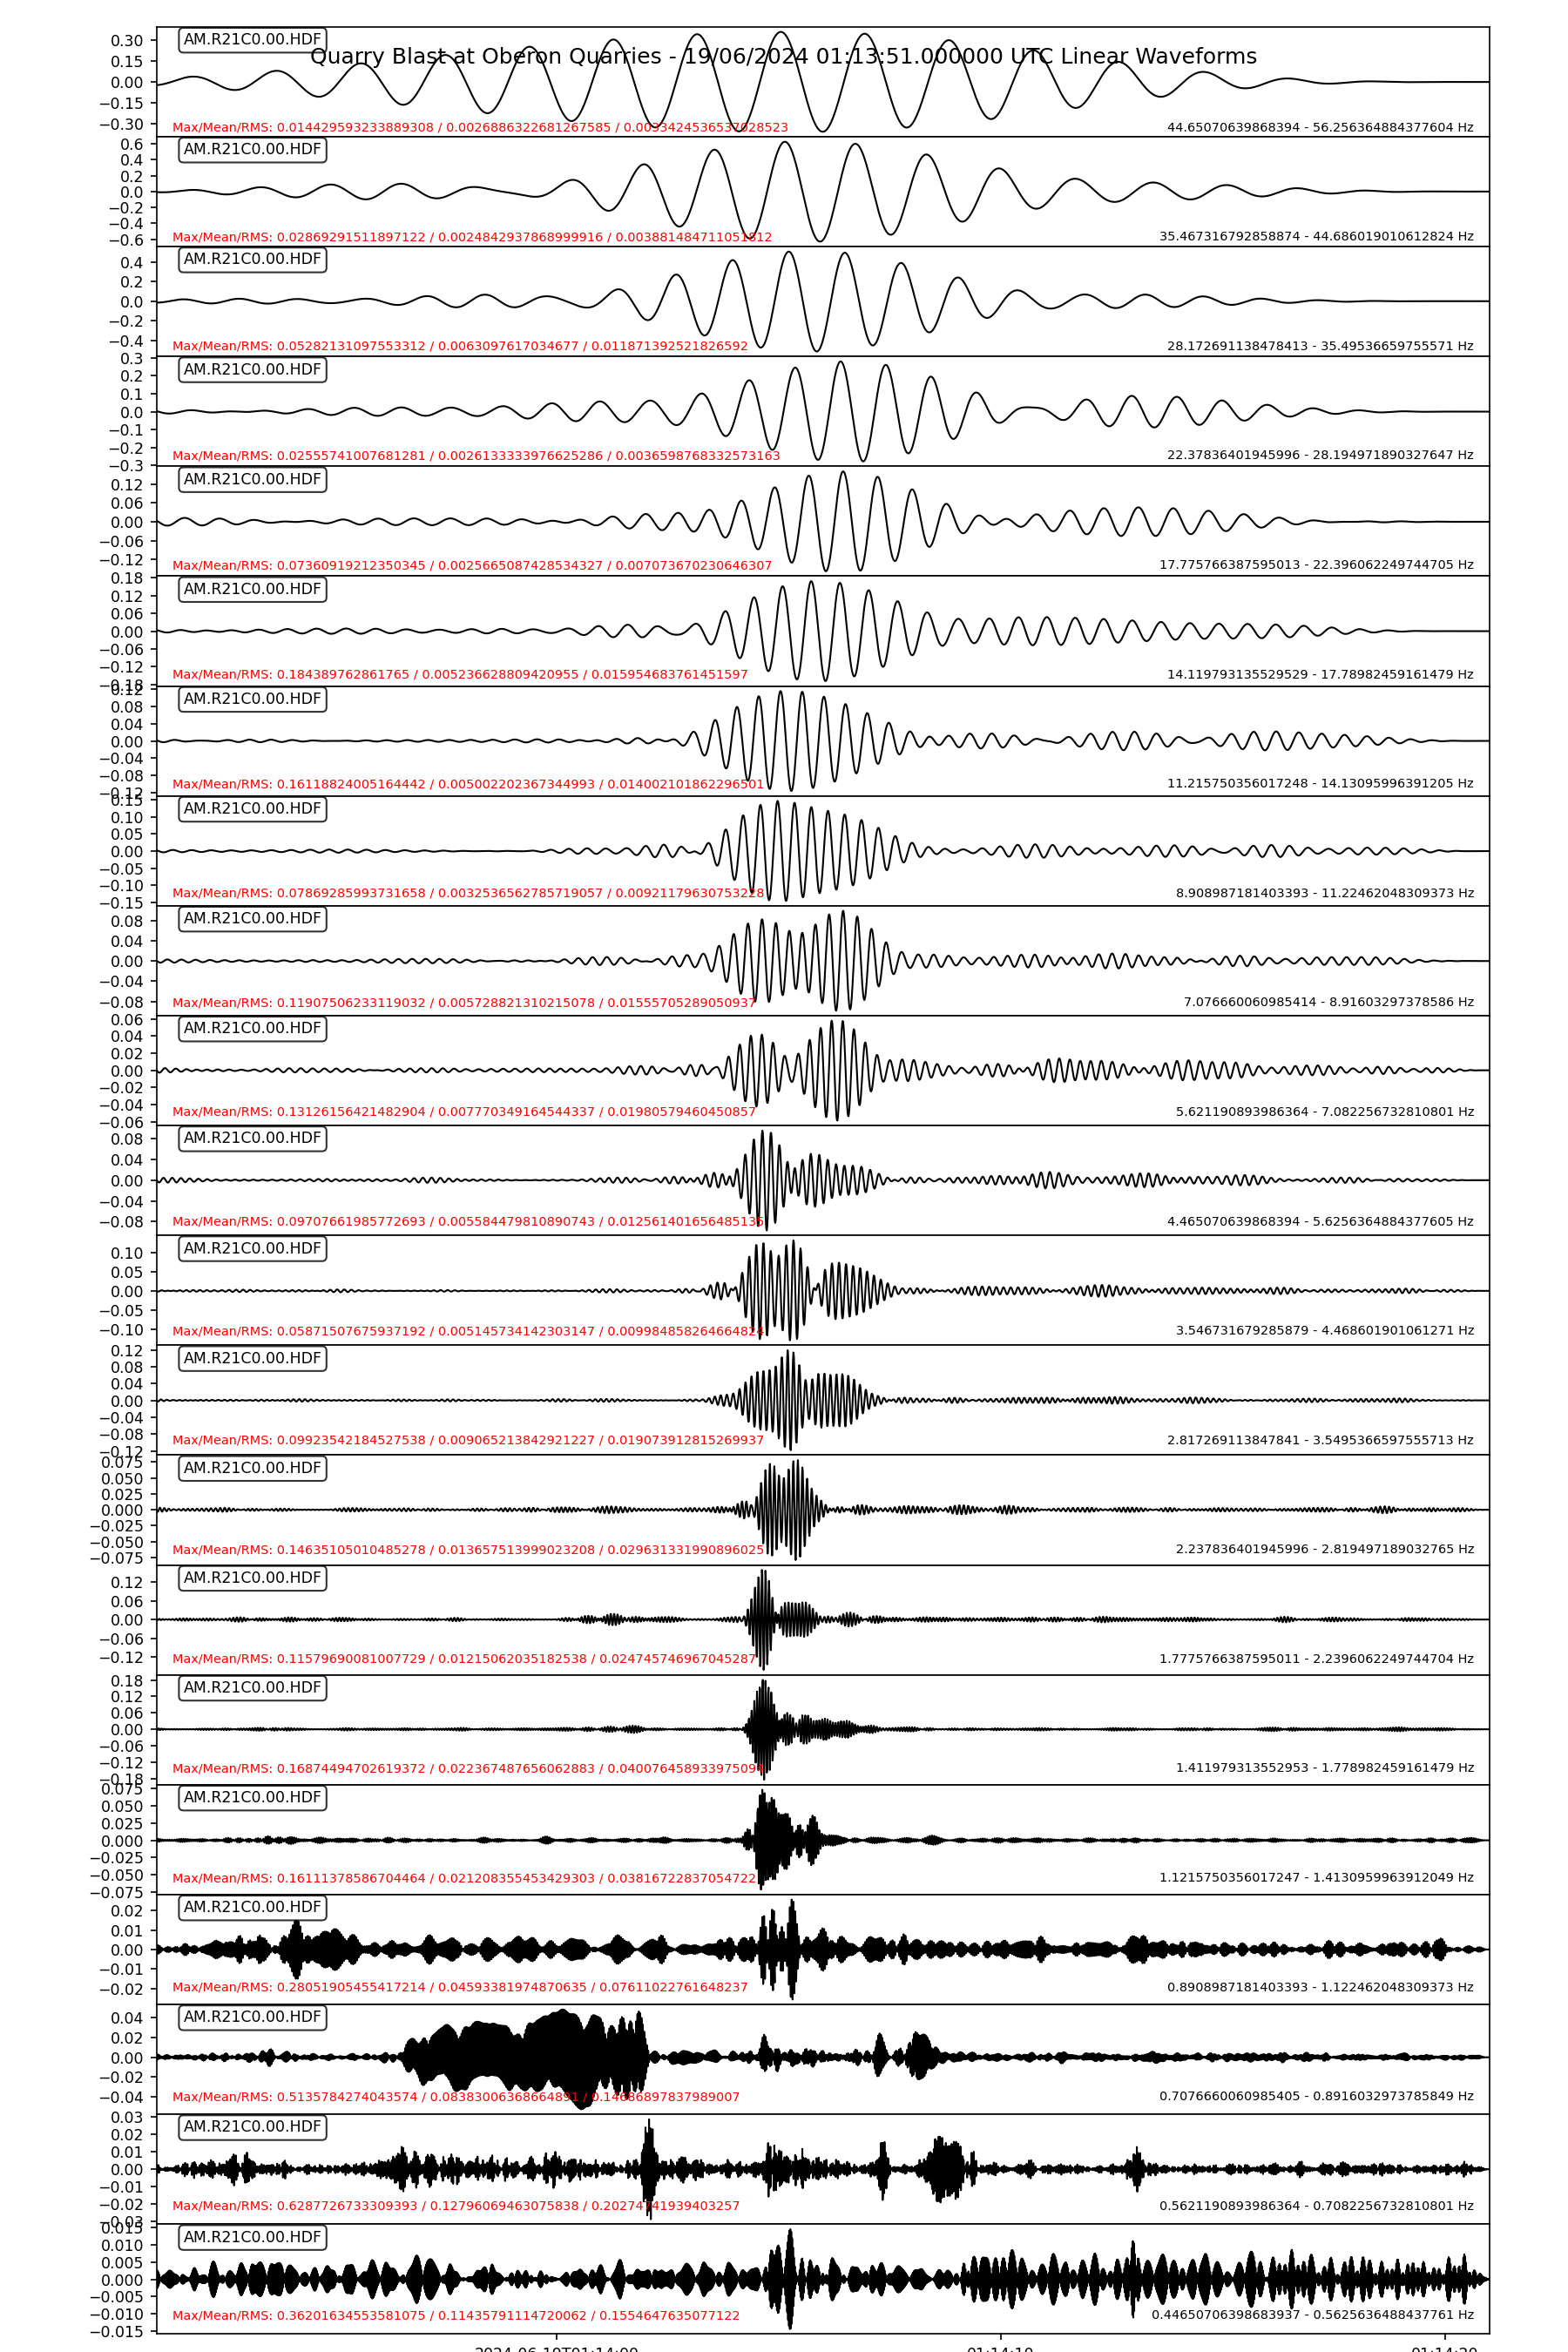
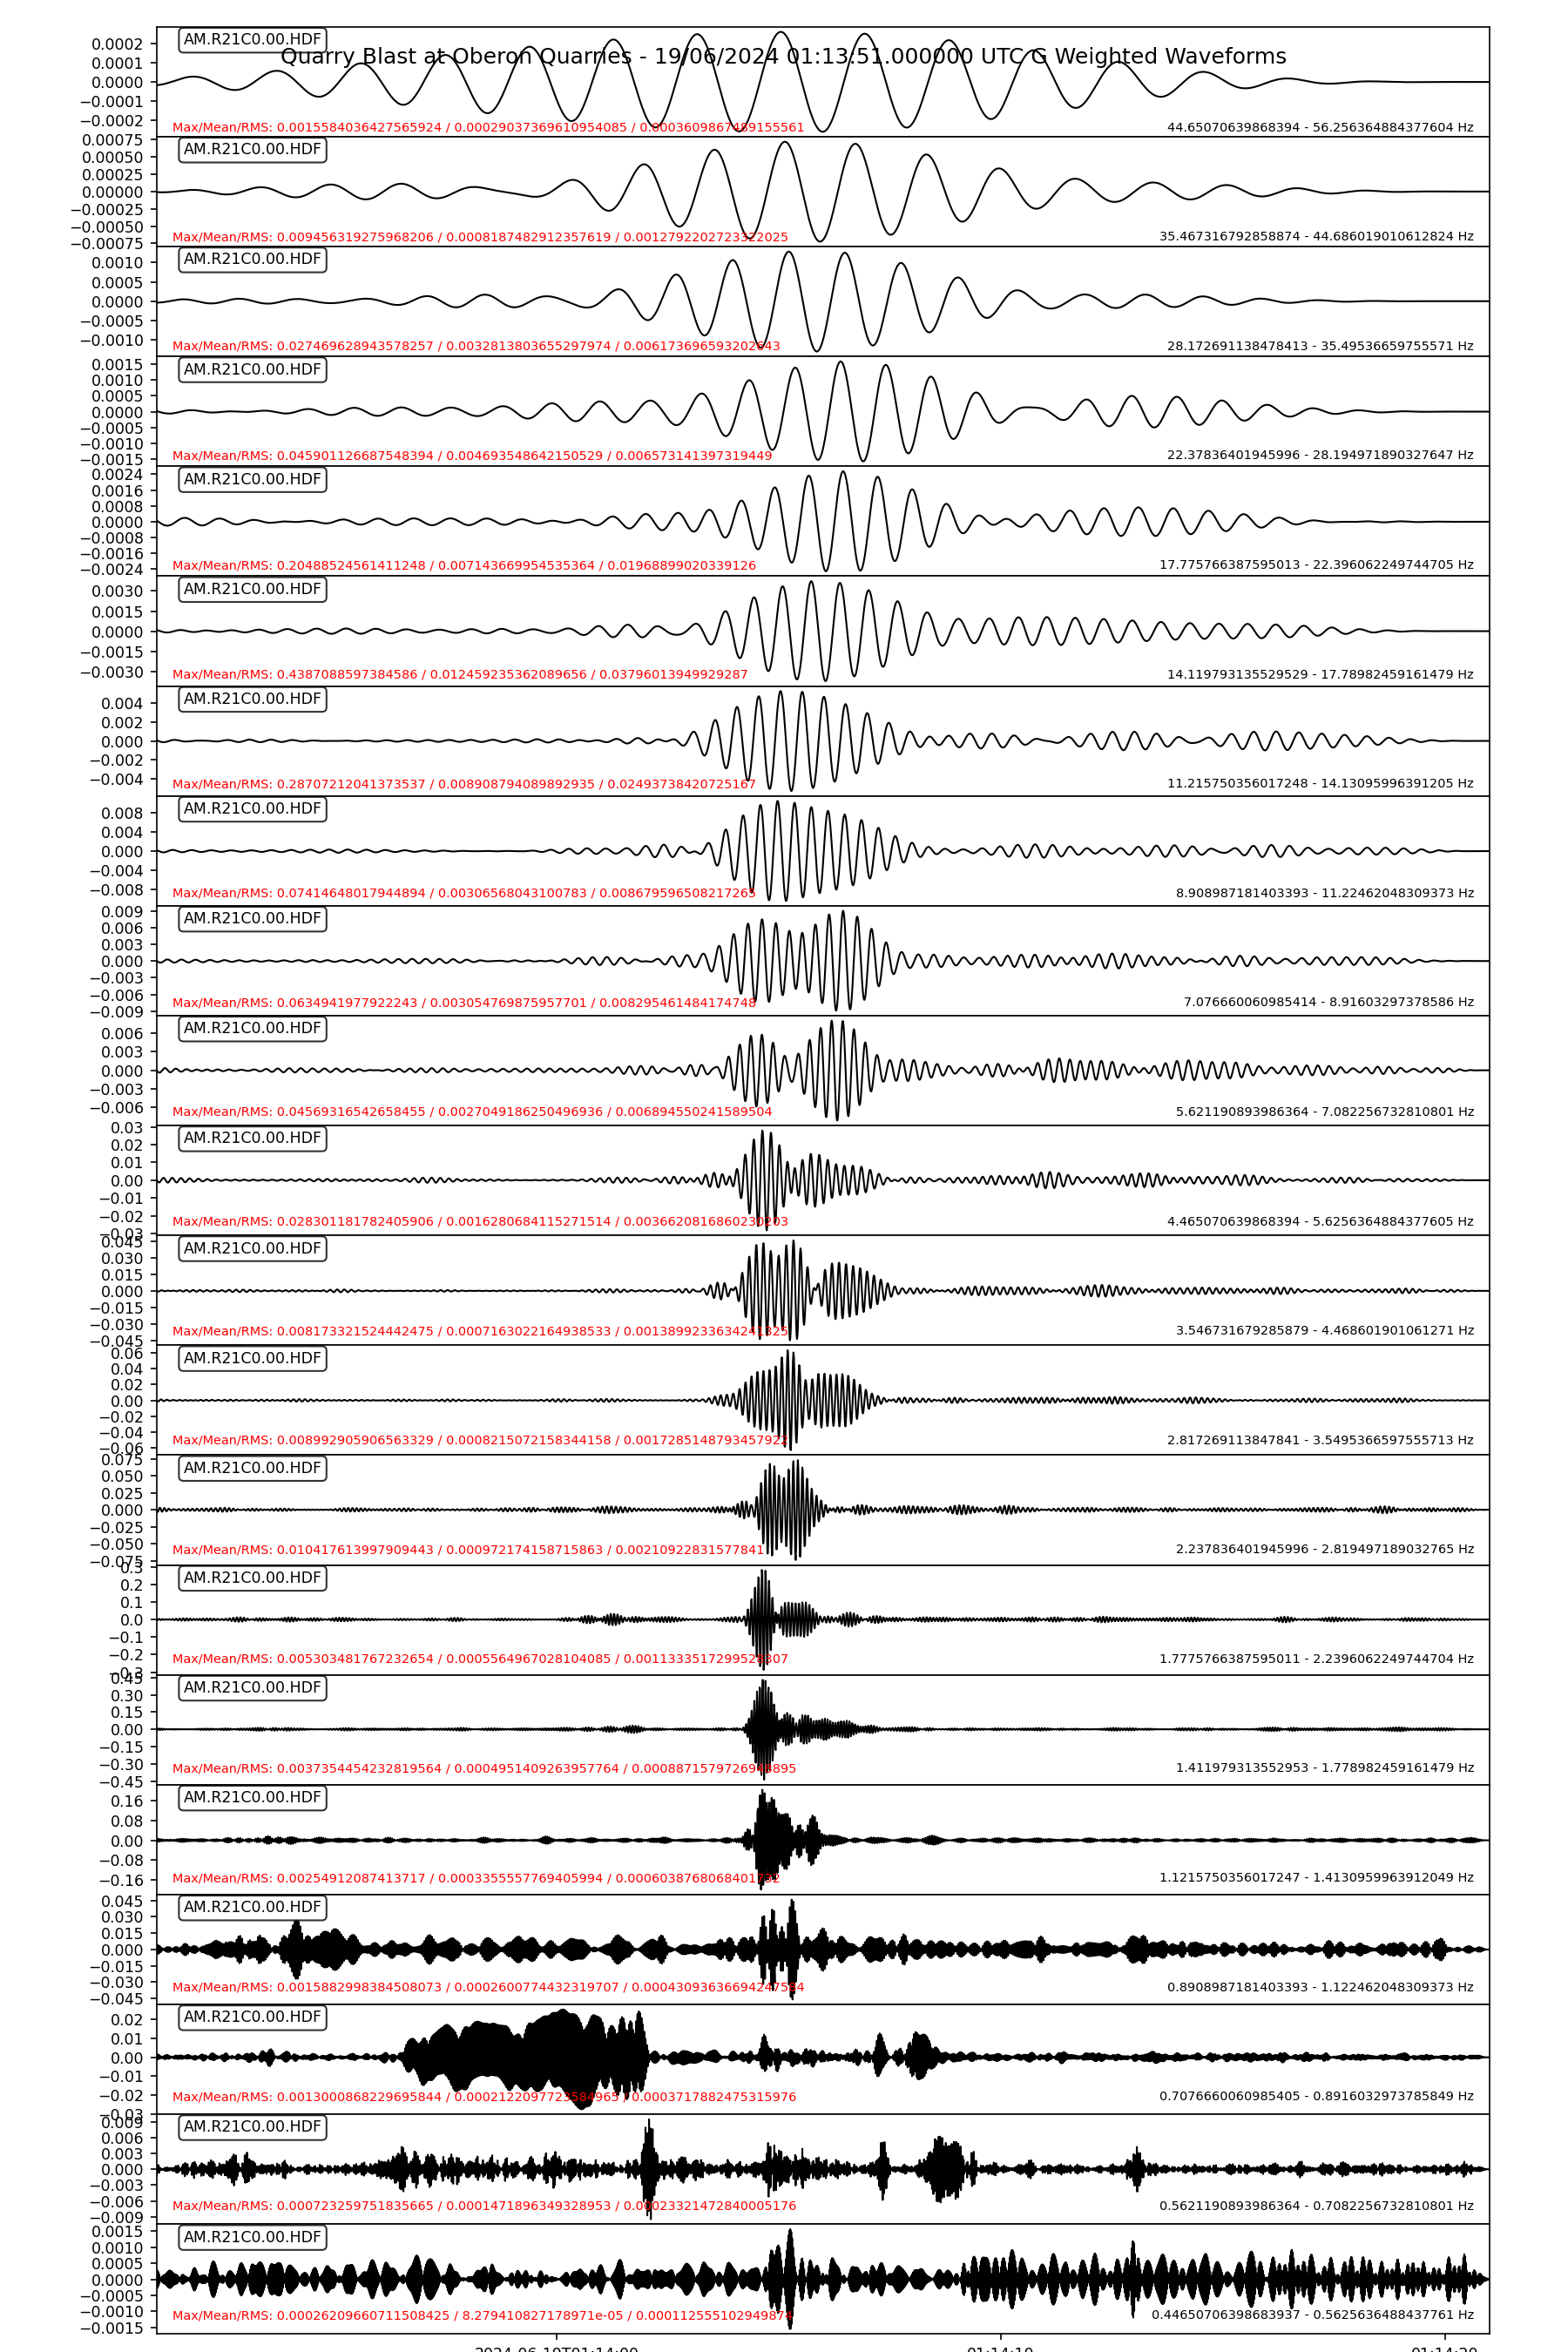
The waveforms from the 1/3 octave G weighted output are added together to reconstruct a single waveform with the G weighting applied in the time domain.
Similarly, the “test” plot in the Infrasound Report is the result of adding the linear 1/3 octave waveforms together. As can be seen it matches the original linear waveform well. This provides confidence that the reconstructed G weighted waveform is a reasonable approximation. This is further reinforced by close agreement between the Octave (not shown) and 1/3 Octave G weighting results, so the bandwidths of 1 and 1/3 of and octave are sufficient for repeatable results.
This is very much a work in progress. Further useful discussion of the need for G weighting of infrasound SPL data can be found starting at page 59 of this slightly dated but still very useful review report.
Citation
@online{sheehan2024,
  author = {Sheehan, Alan},
  title = {G-Weighting Infrasound Data},
  date = {2024-06-24},
  url = {https://oberon-citizen.science/posts/2024-06-24-g-weighting/},
  langid = {en}
}