Shake & Boom
Two founding members of OCSN, Alan Sheehan and Tim Churches, both have Raspberry Shake & Boom seismic and infrasound monitoring devices (with identifiers R21C0 and R5968 respectively) deployed at their properties, about 10-15km south-east of Oberon township and each about 6km apart. The seismic and infrasound data continuously recorded and uploaded by these devices is freely and openly available at the URLs below, but can also be accessed via an API (application programming interface) to allow detailed analyses of the data collected at several, or many stations. Some examples of such analyses undertaken by Alan Sheehan are shown below. OCSN aims to establish a wider network of such devices located at various points in Oberon LGA, and to further develop analysis program code to undertake various types of analysis and validation of the data collected, including infrasound monitoring and analysis.
- Raspberry Shake & Boom station R21C0
- Raspberry Shake & Boom station R5968
Apart from the examples shown below, analyses of seismic and infrasound data collected by the OCSN Raspberry Shake & Boom monitoring stations are published regularly on the OCSN Raspberry Shakes & Booms page on Facebook.
Please also see the OCSN Blog posts page for occasional longer articles on our seismic and infrasound data, including these posts:
Overview
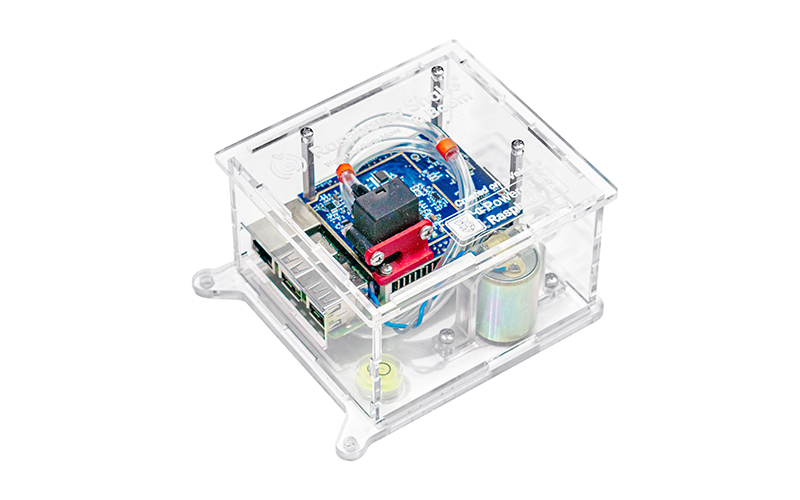
Although Australia is a geographically stable continent, that does not mean that we do not experience frequent earthquakes. Using devices developed over several years by the international Raspberry Shake (see the Raspberry Shake web site for details), based on the tiny but very powerful Raspberry Pi single board computer which is about the size of a deck of playing cards, it is now feasible for citizen scientists to host their own seismic monitoring stations and contribute the data they collect to a worldwide community of people interested in such data. More recently, the ability to also monitor and record infrasound (very low frequency sound waves, mostly below the frequencies which humans can hear) has been added to these devices, allowing the deep rumbles caused by earthquakes to be detected, as well as other sources of infrasound, incuding aircraft, wind blowing through forests, wind turbines and sonic booms from meteorites entering the earth’s atmosphere. Please see the page on meteorite tracking for more information on this.
Raspberry Shake and Boom capabilities
Detecting distant earthquakes
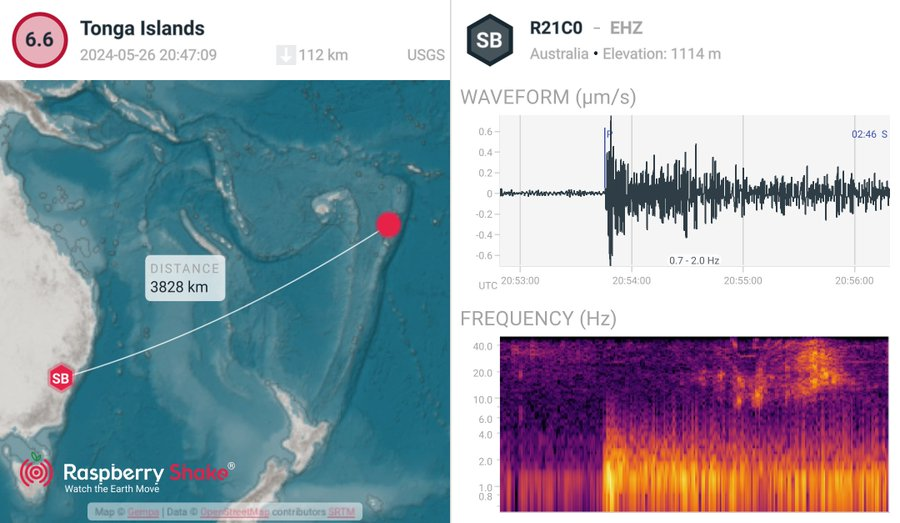
You don’t need special skills to use a Raspberry Shake and Boom (RS&B for short) – the example below is from the very nice ShakeNet phone app provided by the Raspberry Shake community. It lists earthquakes happening world-wide so you can see if your RS&B station detected them or not. As you can see, an RS&B station in Oberon LGA can readily detect earthquakes thousands of kilometres away.
Detecting local earthquakes
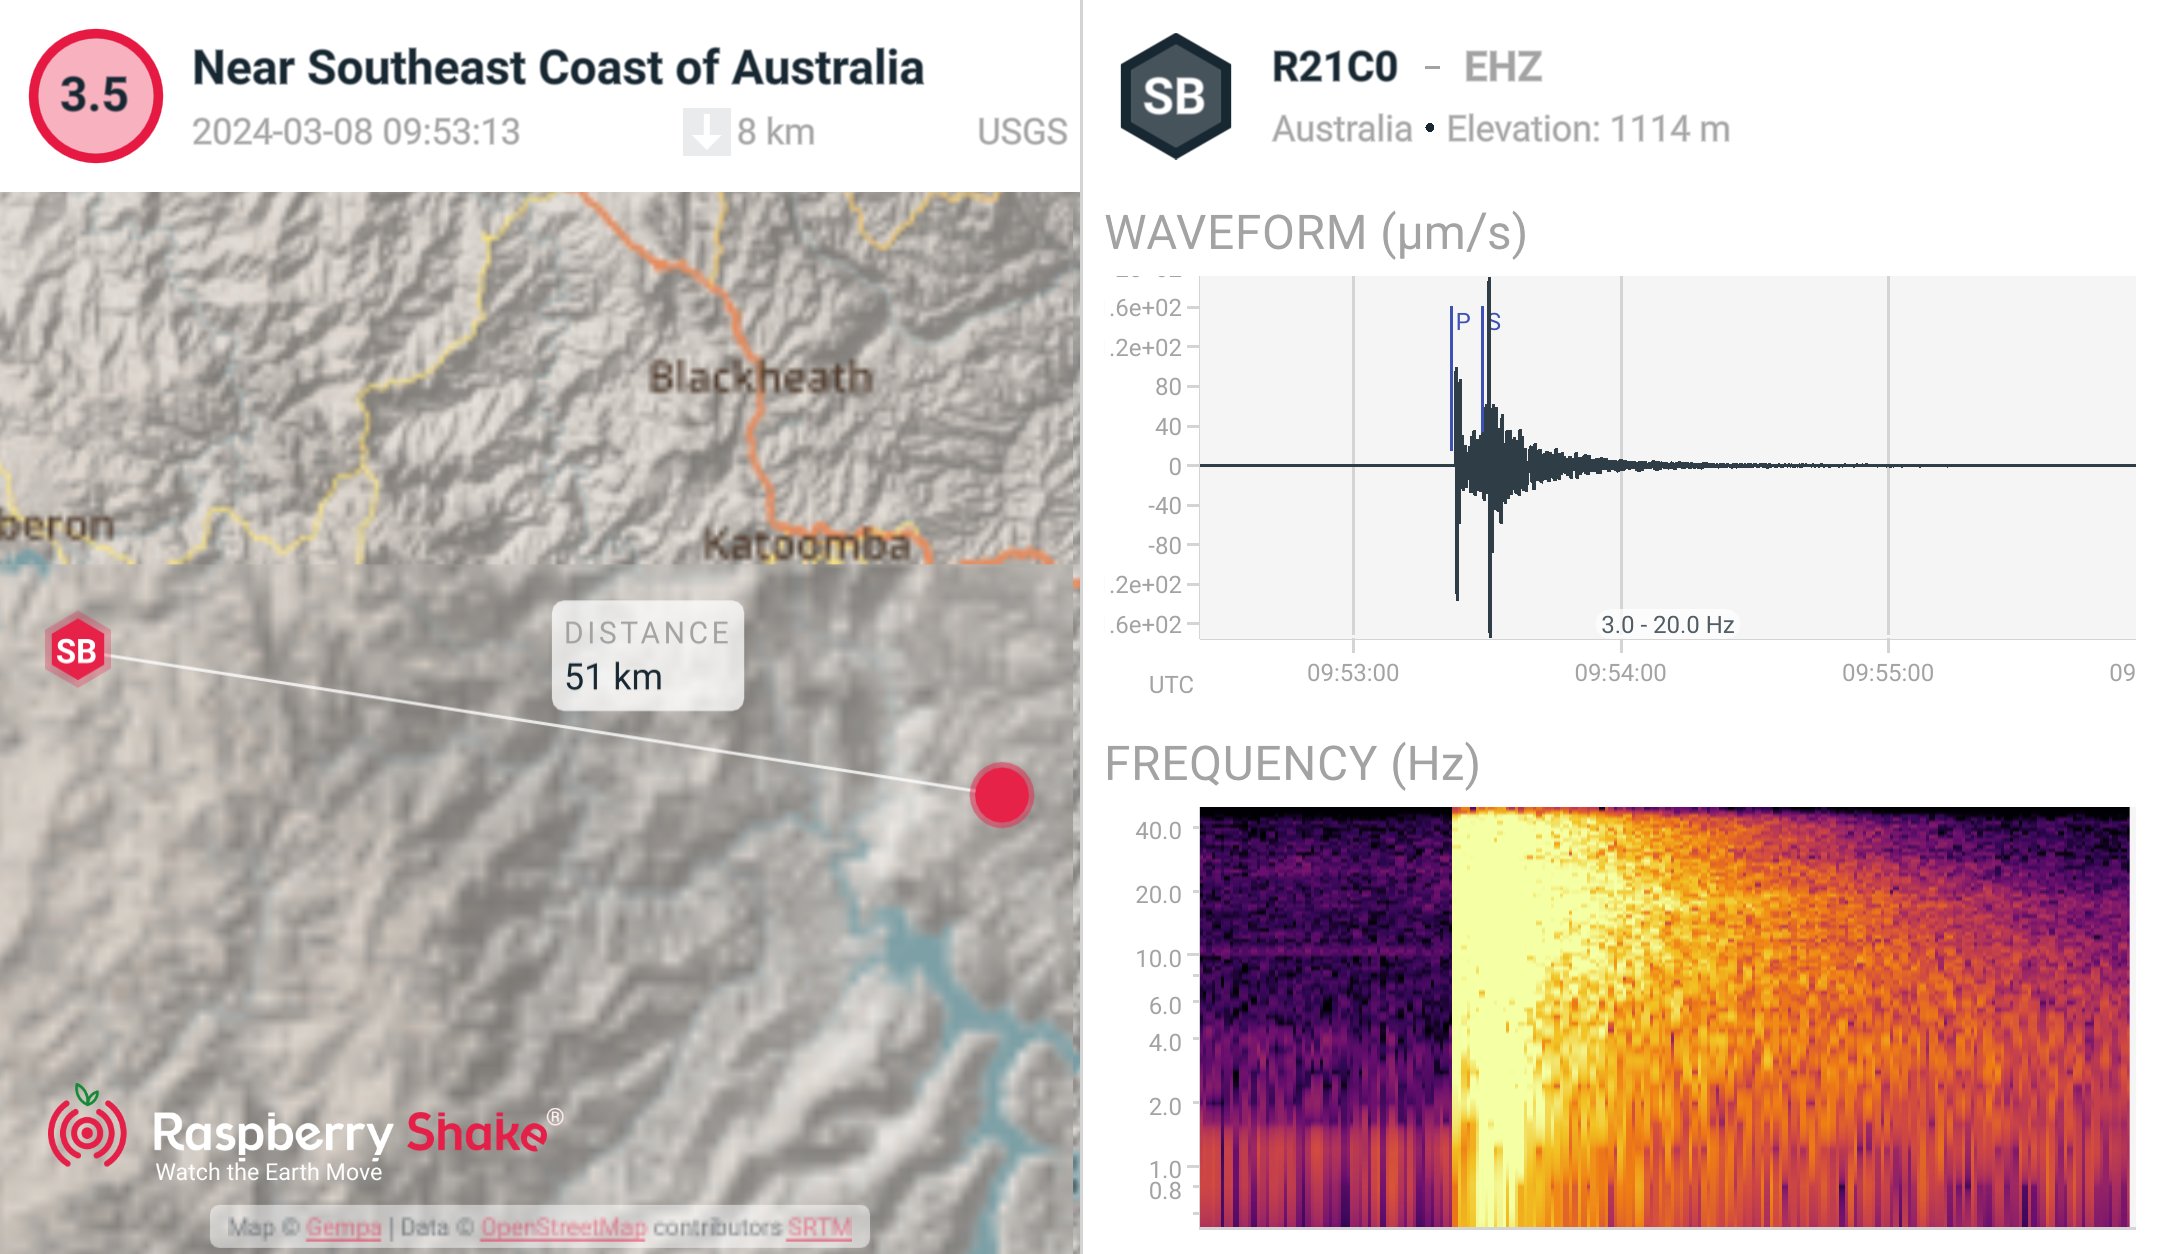
Of course, the devices can also detect less intense local earthquakes, as shown below.
More is better!
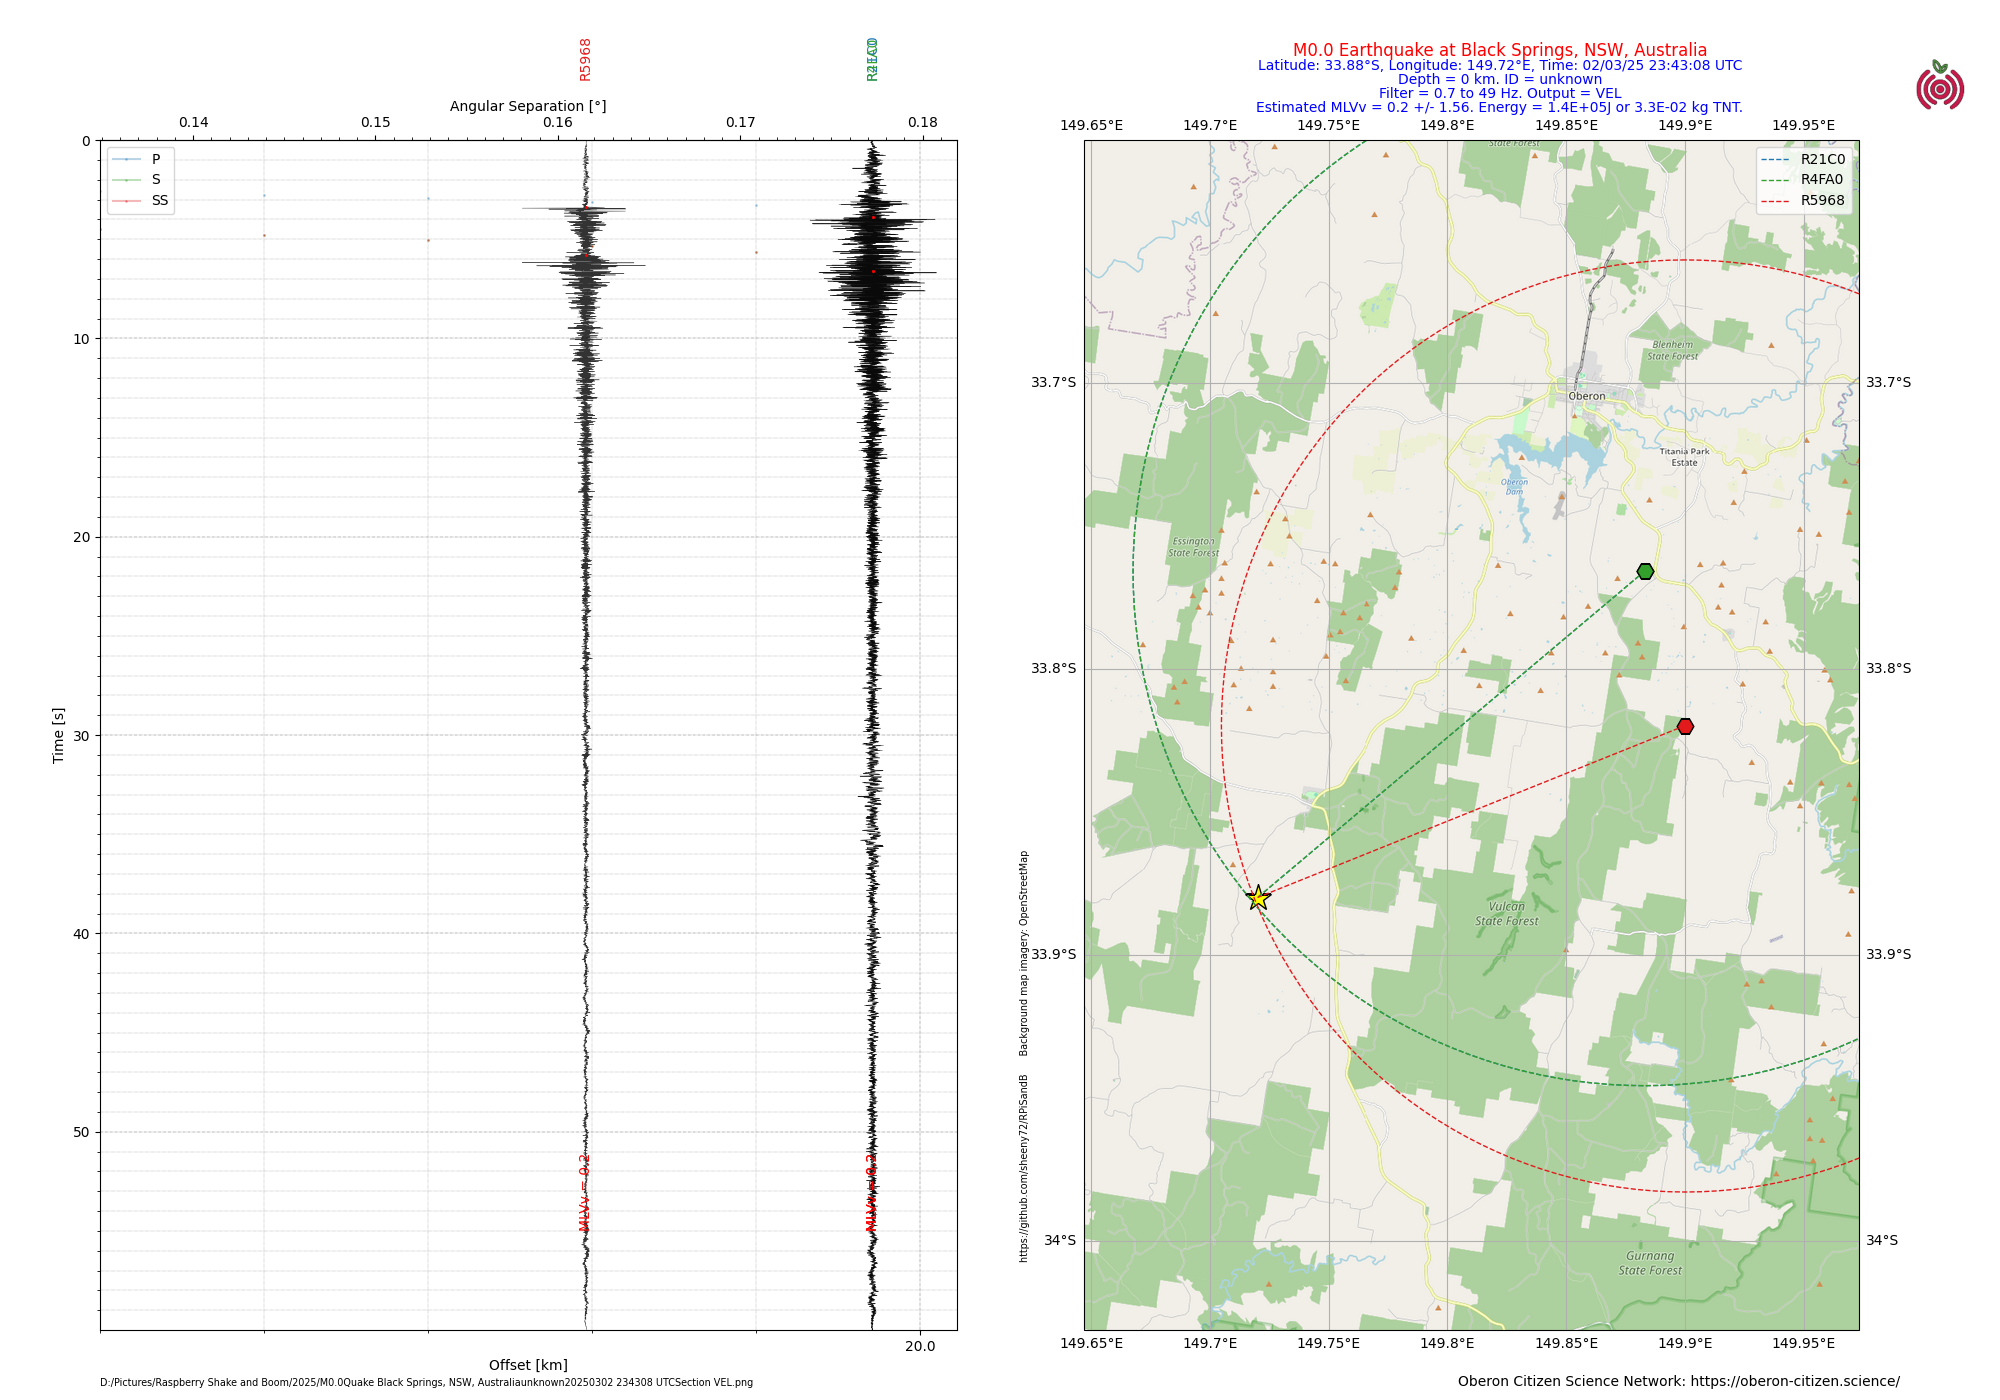
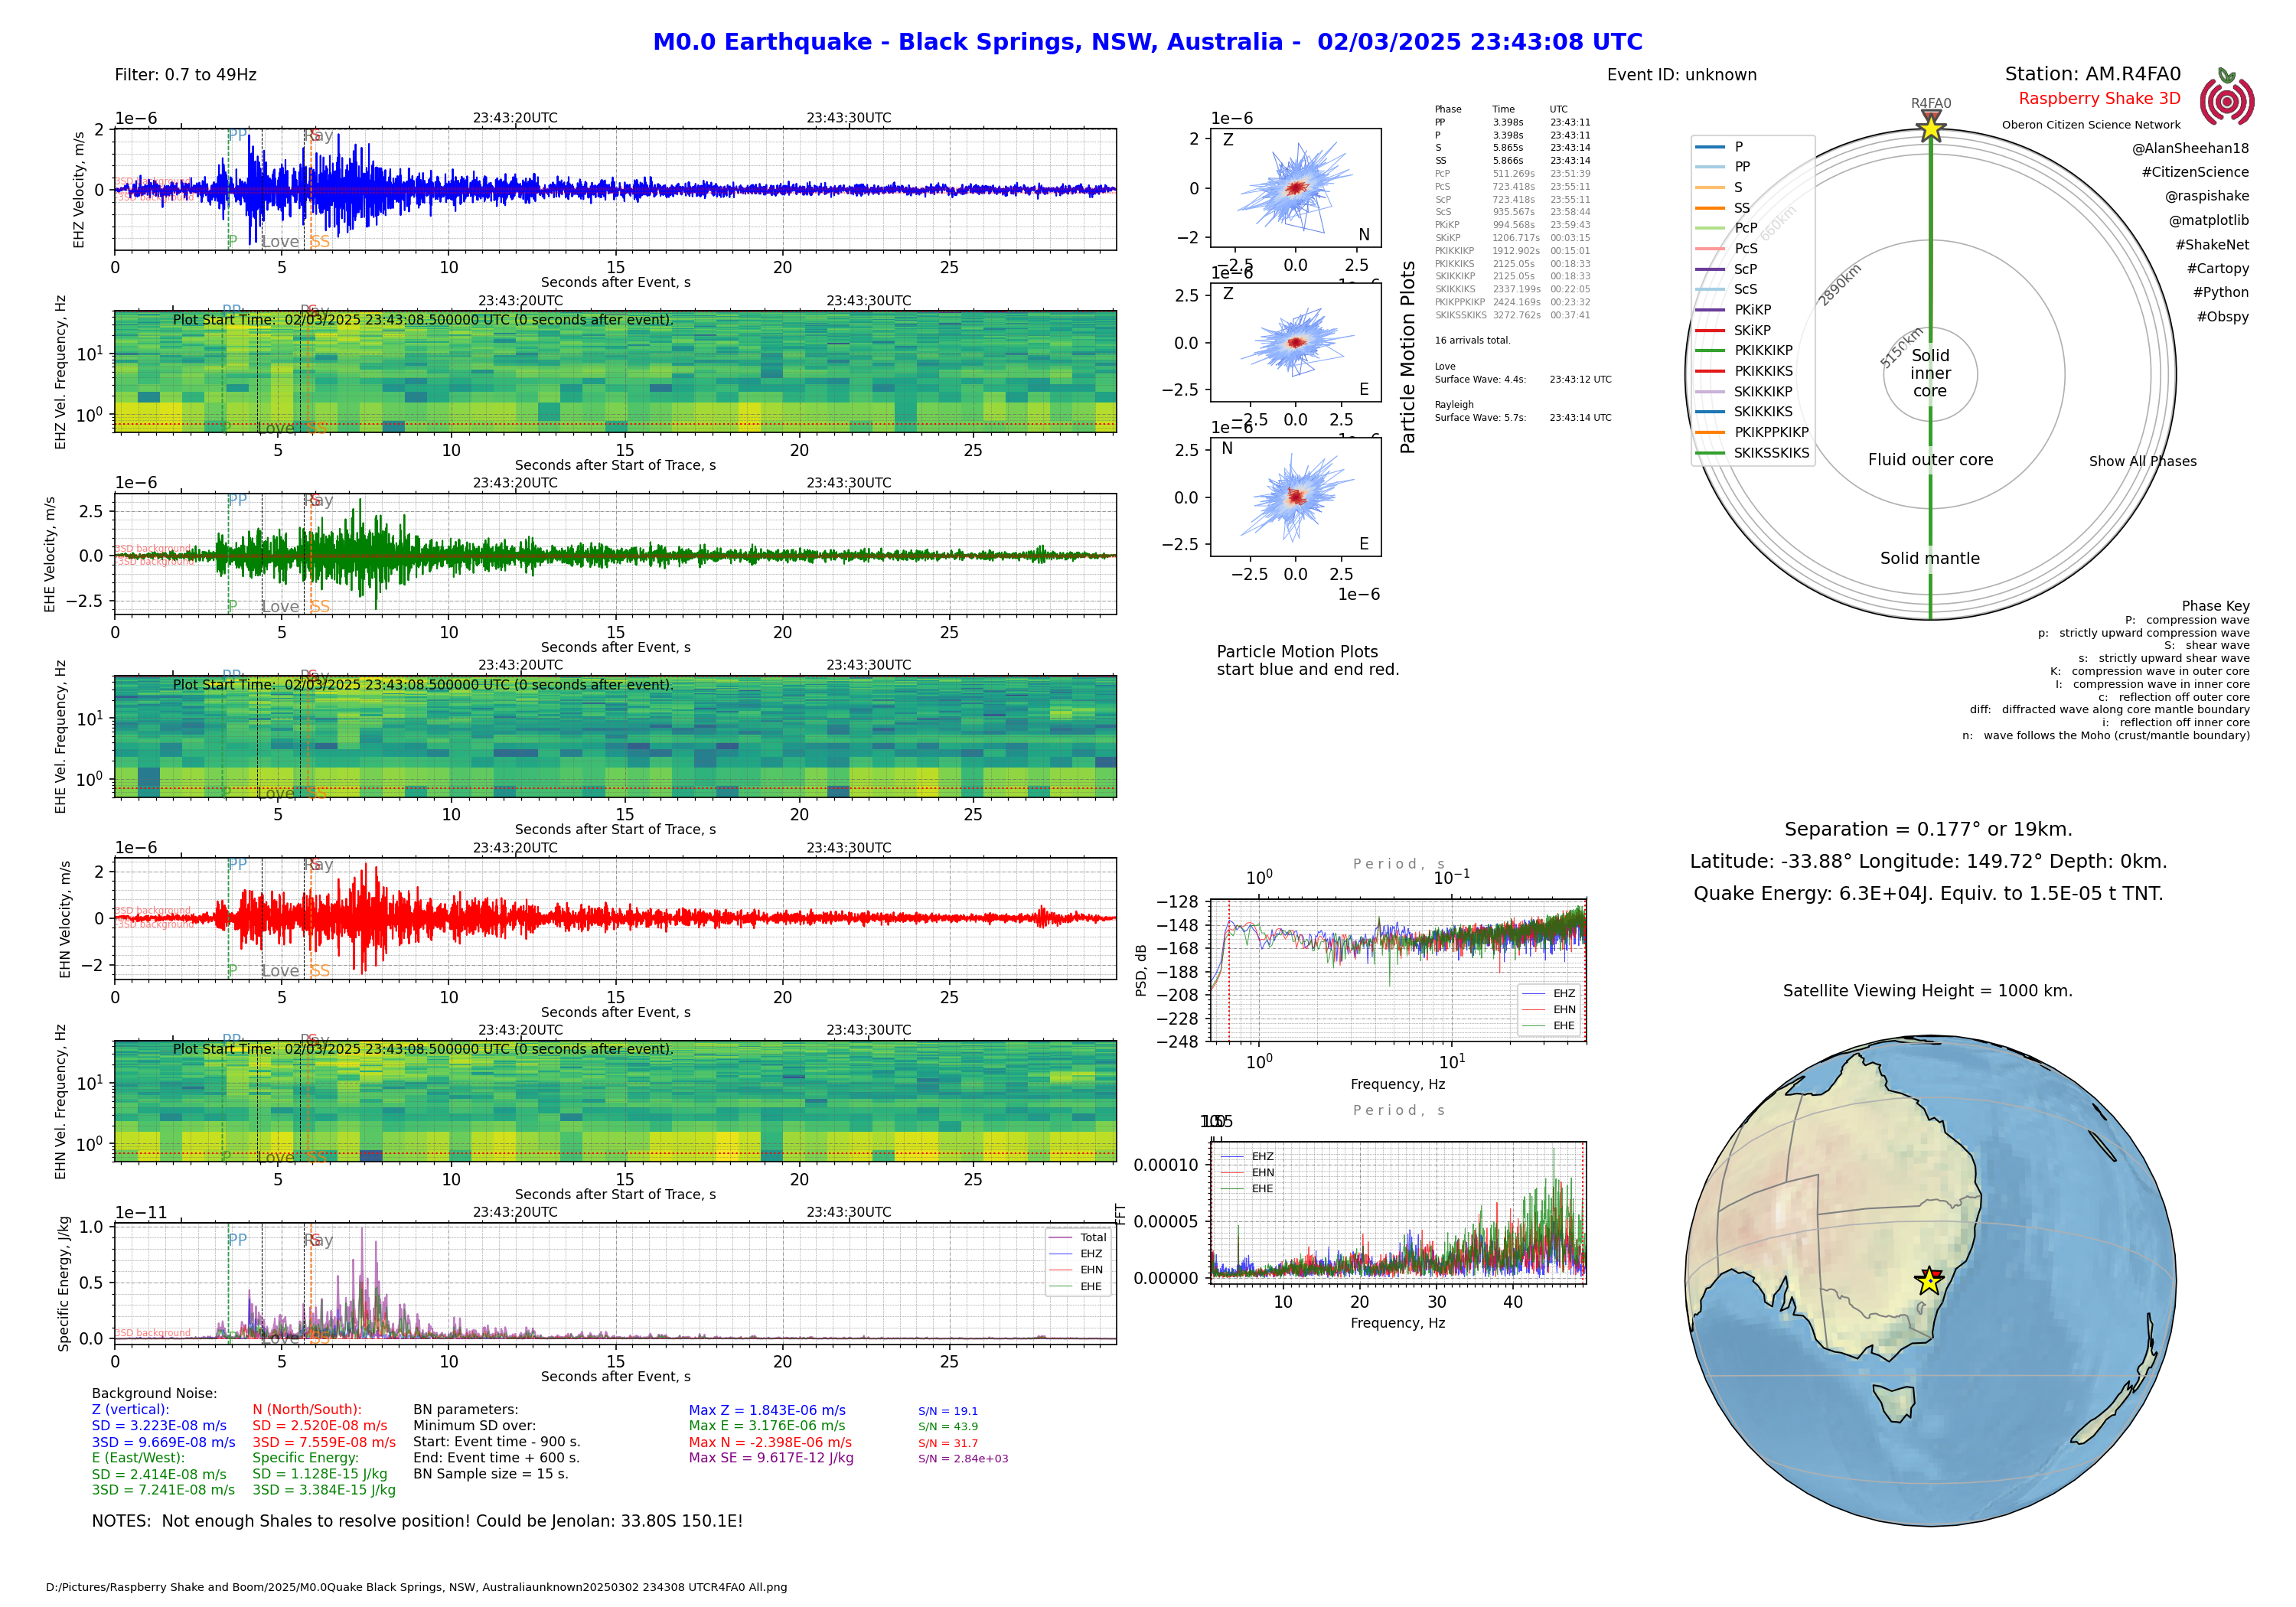
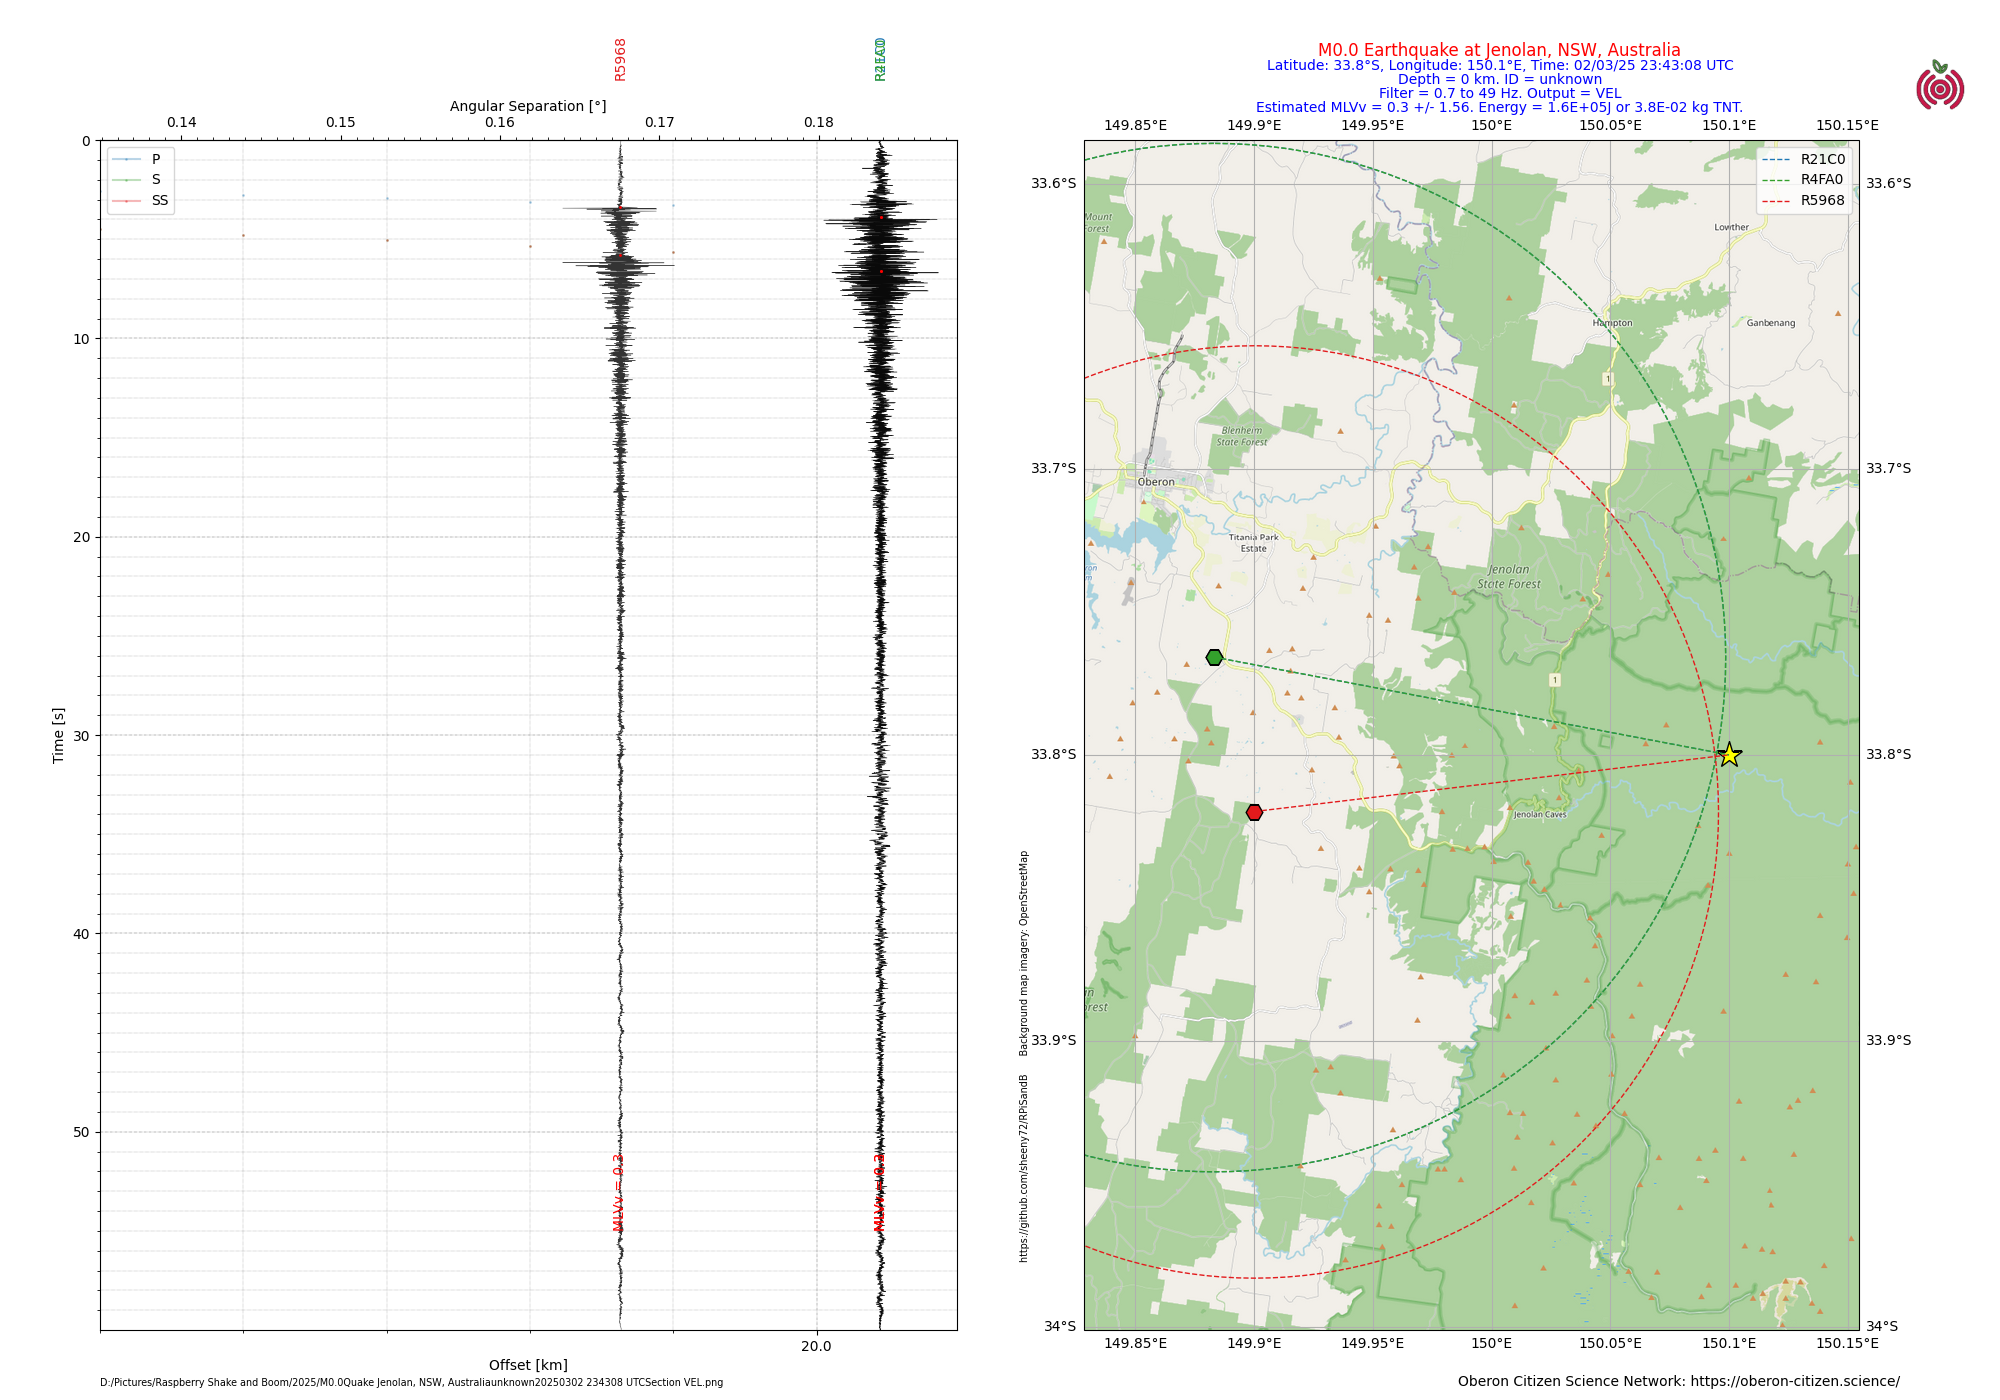
A dense (close) network of Raspberry Shakes and Booms allows detection of very small local earthquakes not detected by more distant seismographs. In the example shown below, the earthquake is detected and verified by the existing two-node OCSN seismic network, but can’t be located properly due to inadequate triangulation of stations/sites. This the earthquake could be under Black Springs (south-west of Oberon township) or in the Jenolan area (south-east of Oberon). Analysis of the particle motion plots on the RS3D station R4FA0 suggests that Black Springs is more likely, but more stations in the Oberon region with slightly greater geographic spread are required to be definitive.
Combined seismic and infrasound analysis
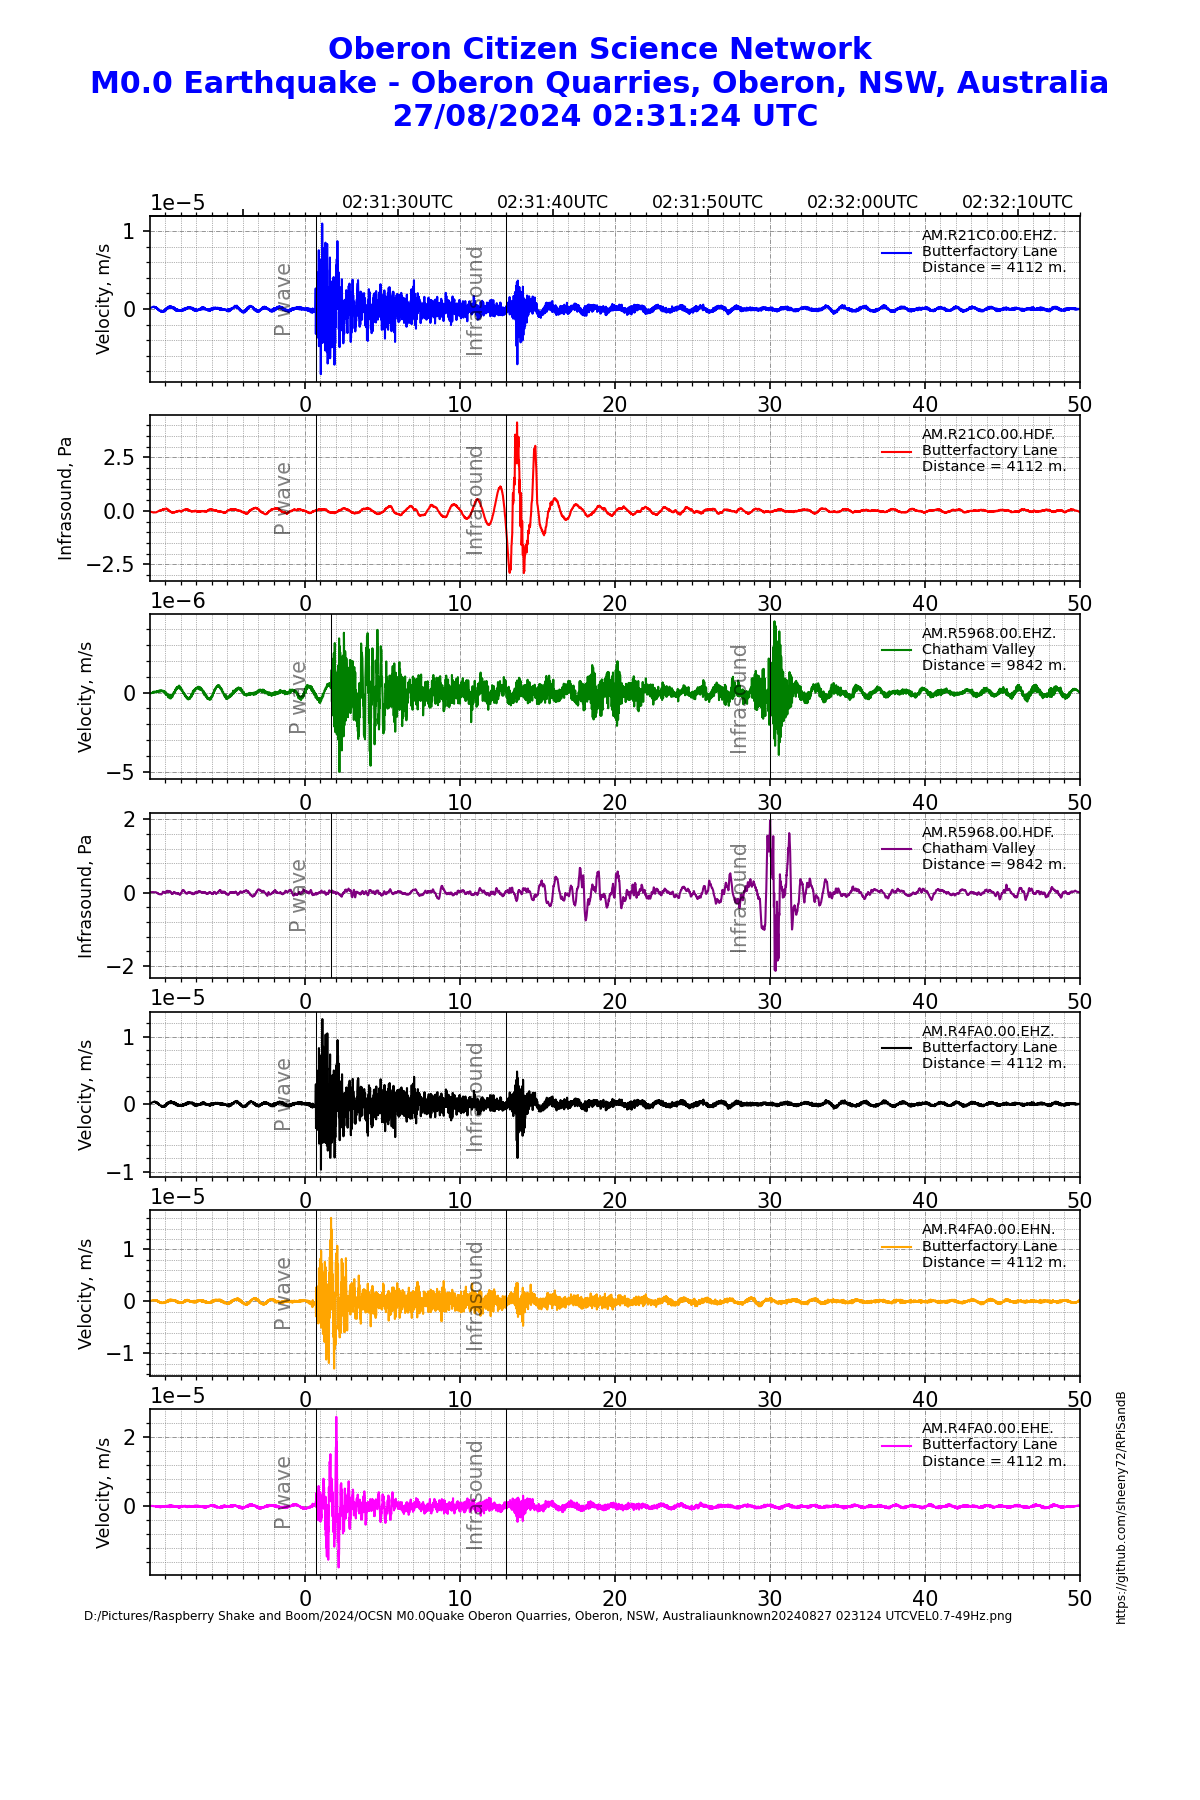
A dense (close) network of Raspberry Shake and Booms allows for some unique science opportunities, such as analysis of the interaction between seismic and infrasound signals. The example below, captured by the OCSN two-node network, shows the seismic and infrasound signals from a nearby quarry blast, and shows how the slower infrasound waves move the ground when they arrive to produce a seismic signal.
Another combined seismic and infrasound analysis
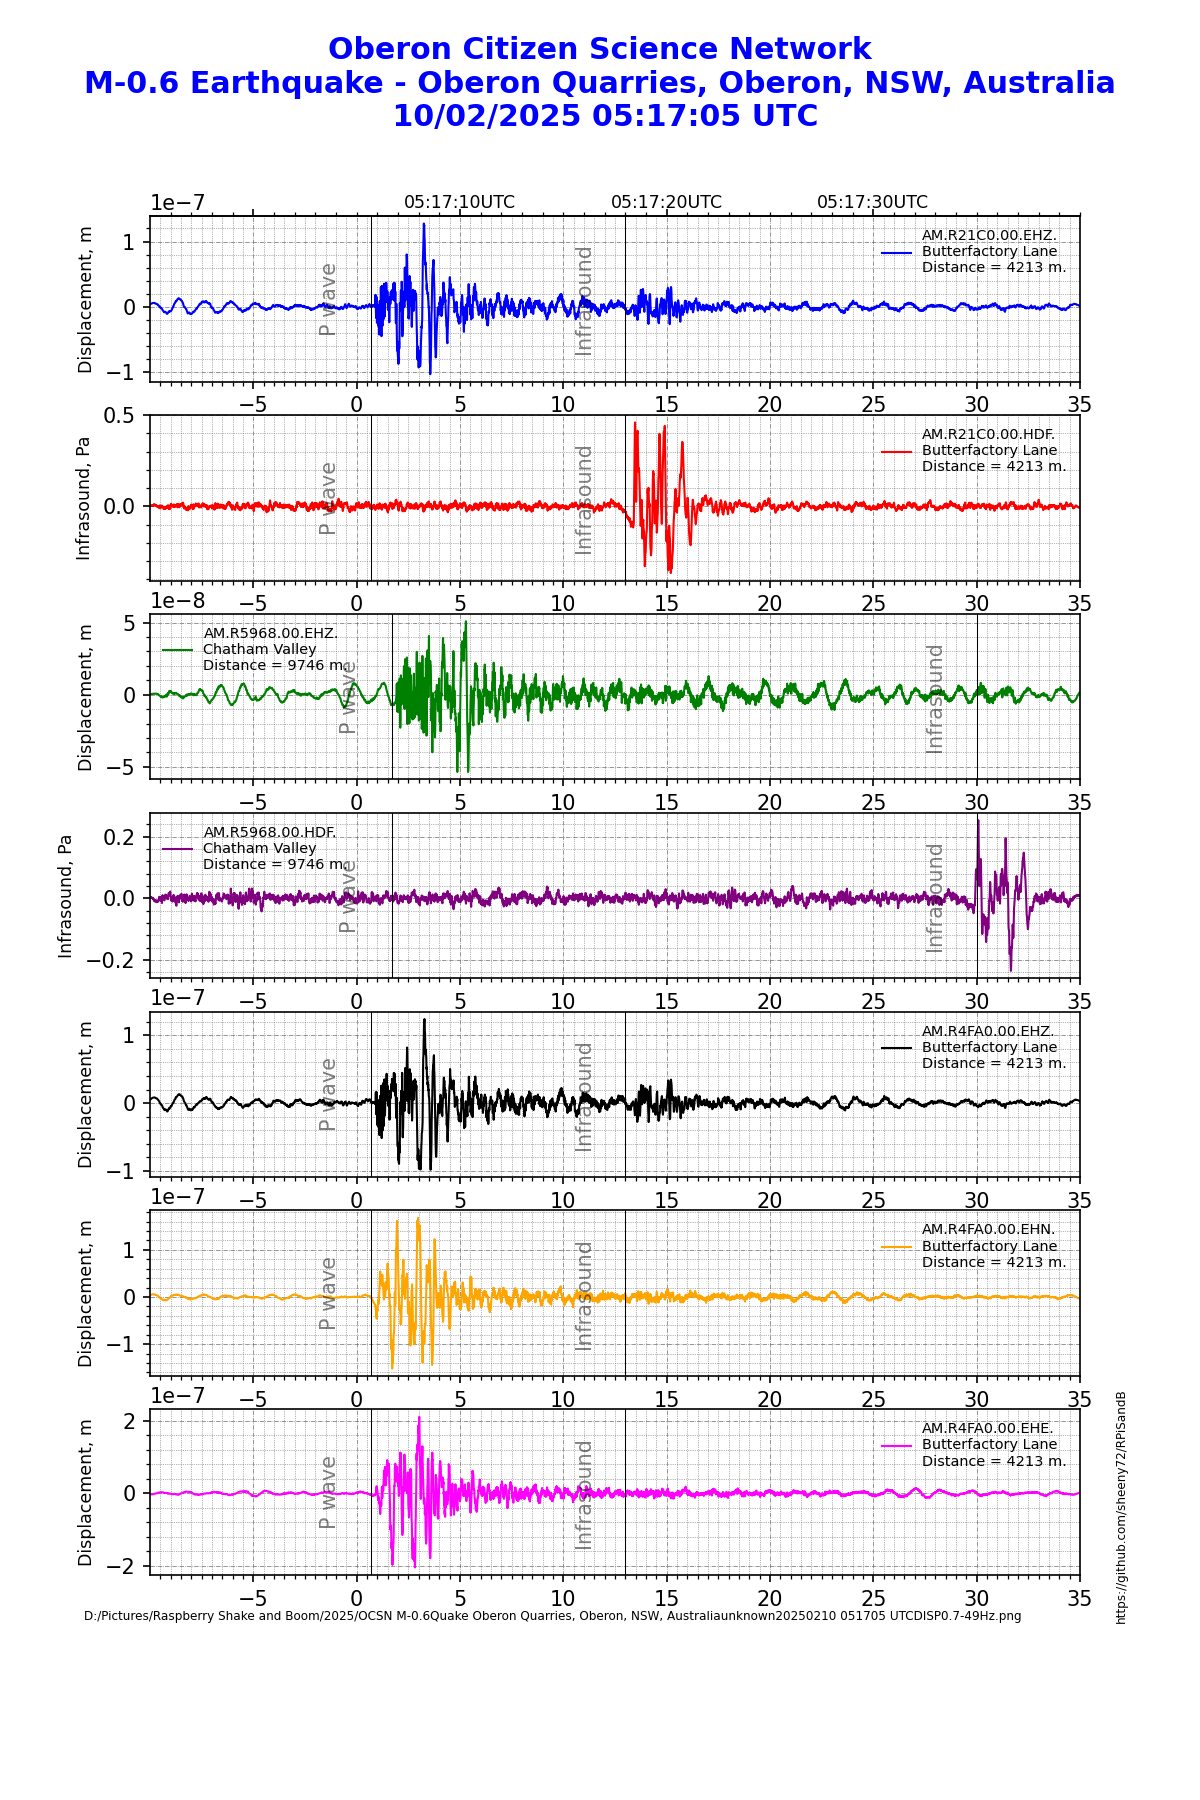
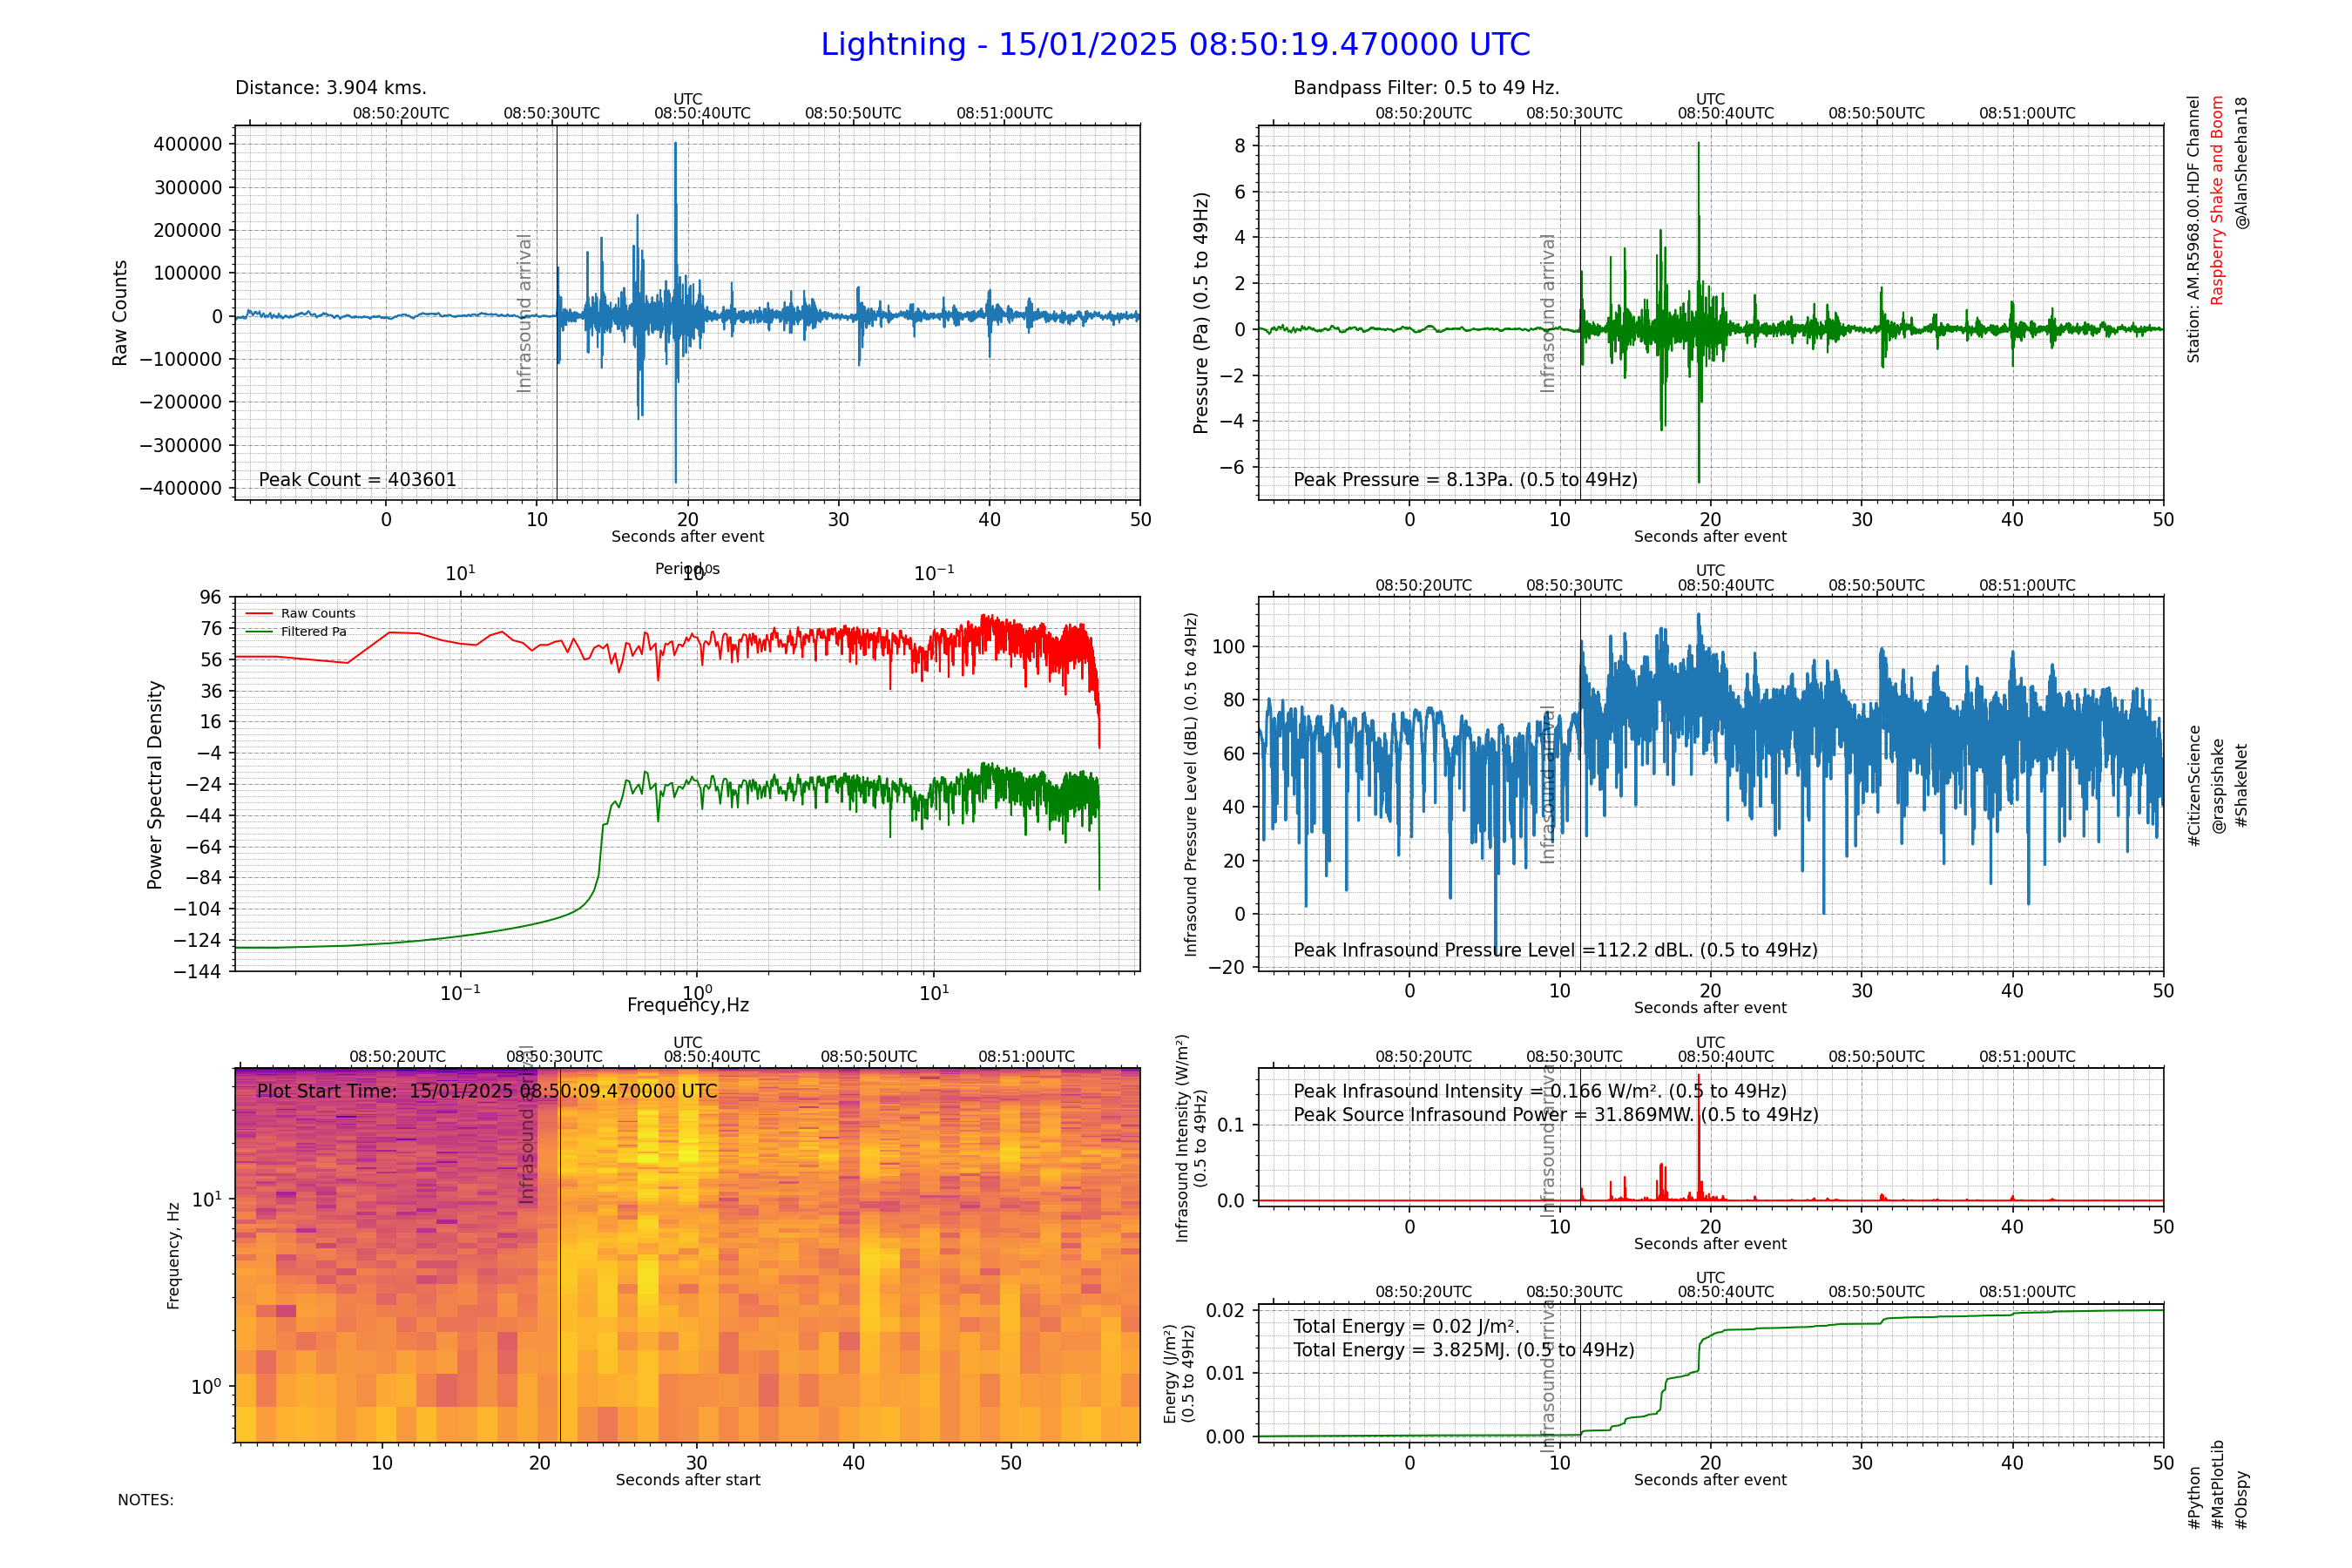
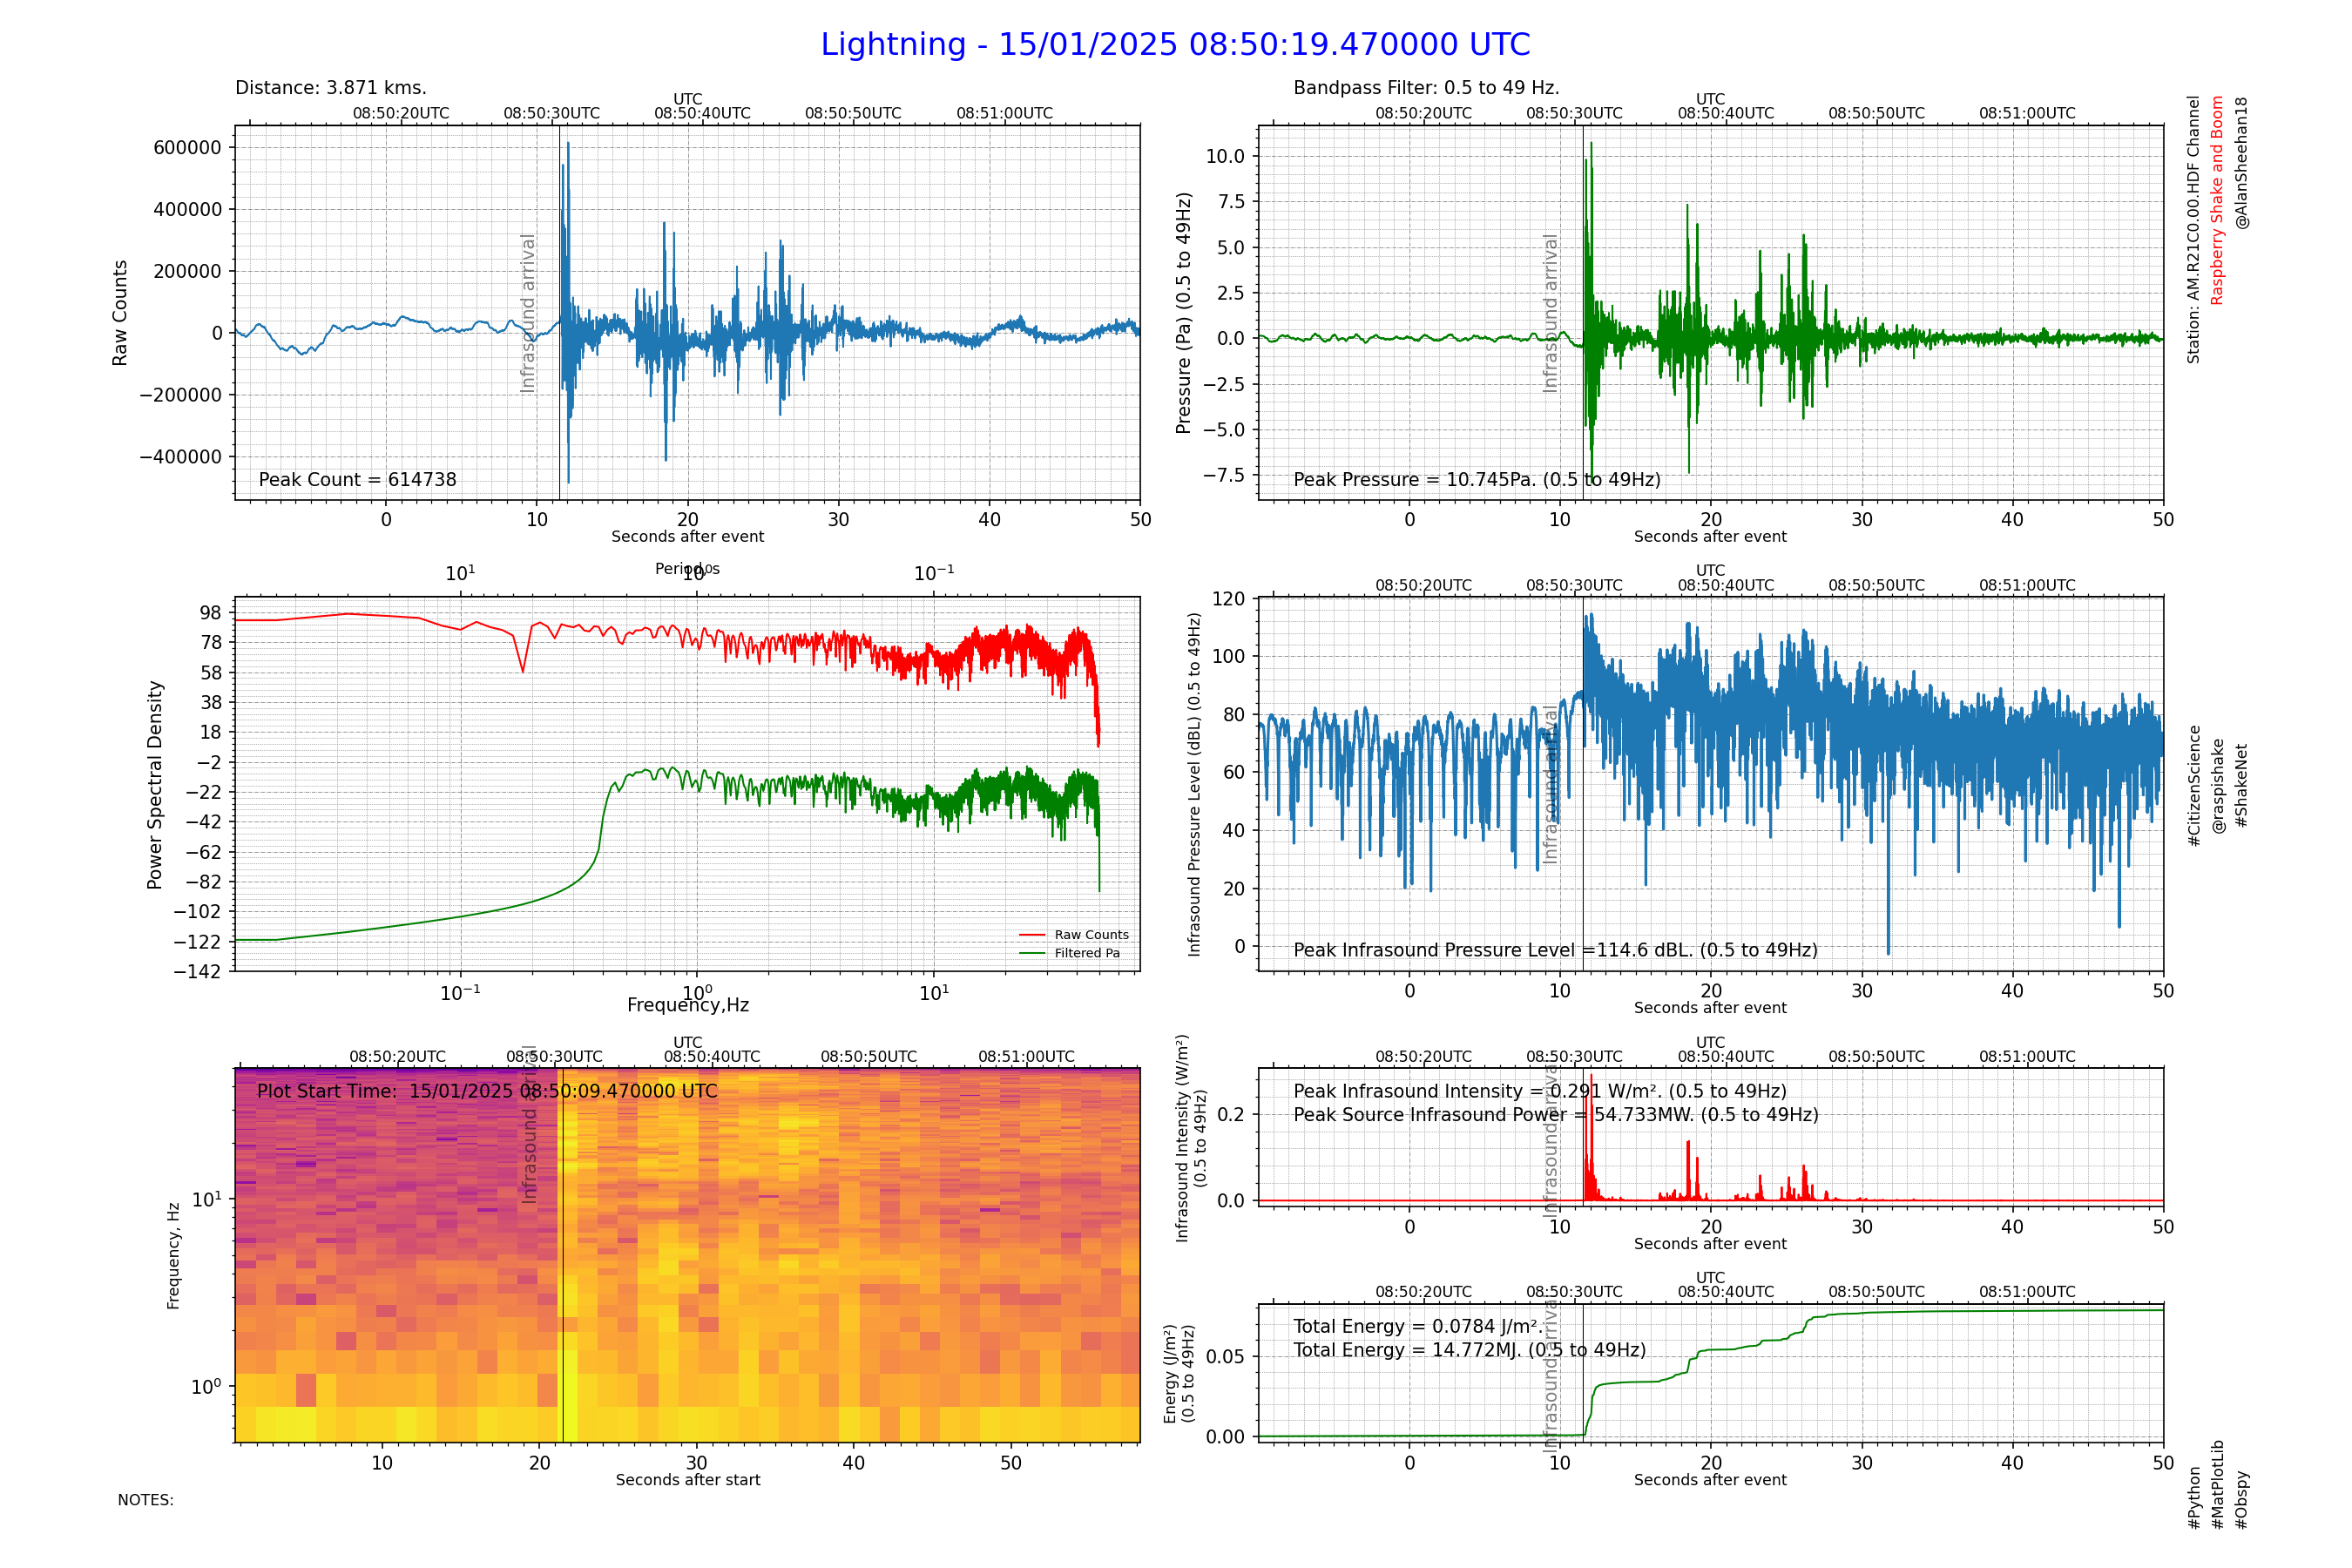
The example below again clearly shows the interaction between the arriving infrasound wave and the Earth’s crust (and hence the seismic signal), but there’s another effect revealed here.
Look closely at the infrasound trace for station R21C0. The infrasound signal begins to increase BEFORE the primary infrasound wave from the quarry blast arrives! This increase is due to the approaching seismic wave producing its own rumbling infrasound.
The effect is more pronounced for station R5968. Notice the increased amplitude signal at about 15 to 20s after the quarry blast. This is the approaching seismic wave producing its own infrasound, but then look at the seismic trace for R5968 at that time - the infrasound is still strong enough to produce its own seismic signal!
These sorts of observations may occasionally be glimpsed on solitary seismic stations, but are unexplainable. A dense network of Raspberry Shake and Booms, however, provides all the tools needed to observe, verify and understand what’s going on. This presents a unique opportunity for real science to be undertaken by citizens and school students!
Mine blasts
Mine blasts are not reported by the official earthquake monitoring organisations. Obviously they detect them, but are quickly weeded out of the reporting process. Very occasionally legitimate earthquakes can be dismissed as mine blasts and not reported - at least not initially.
Detection of mine blasts started out as a curiosity and challenge for OCSN members – to learn how to do it. There are typically 6 to 12 mine blasts in the Hunter and Ulan coal mining areas each weekday. Occasionally on a Saturday, but generally the weekends are blast free. Blasts also occur more locally at Oberon Quarries, the Hytec Quarry near the Cox’s River, Cadia Gold Mine, etc.
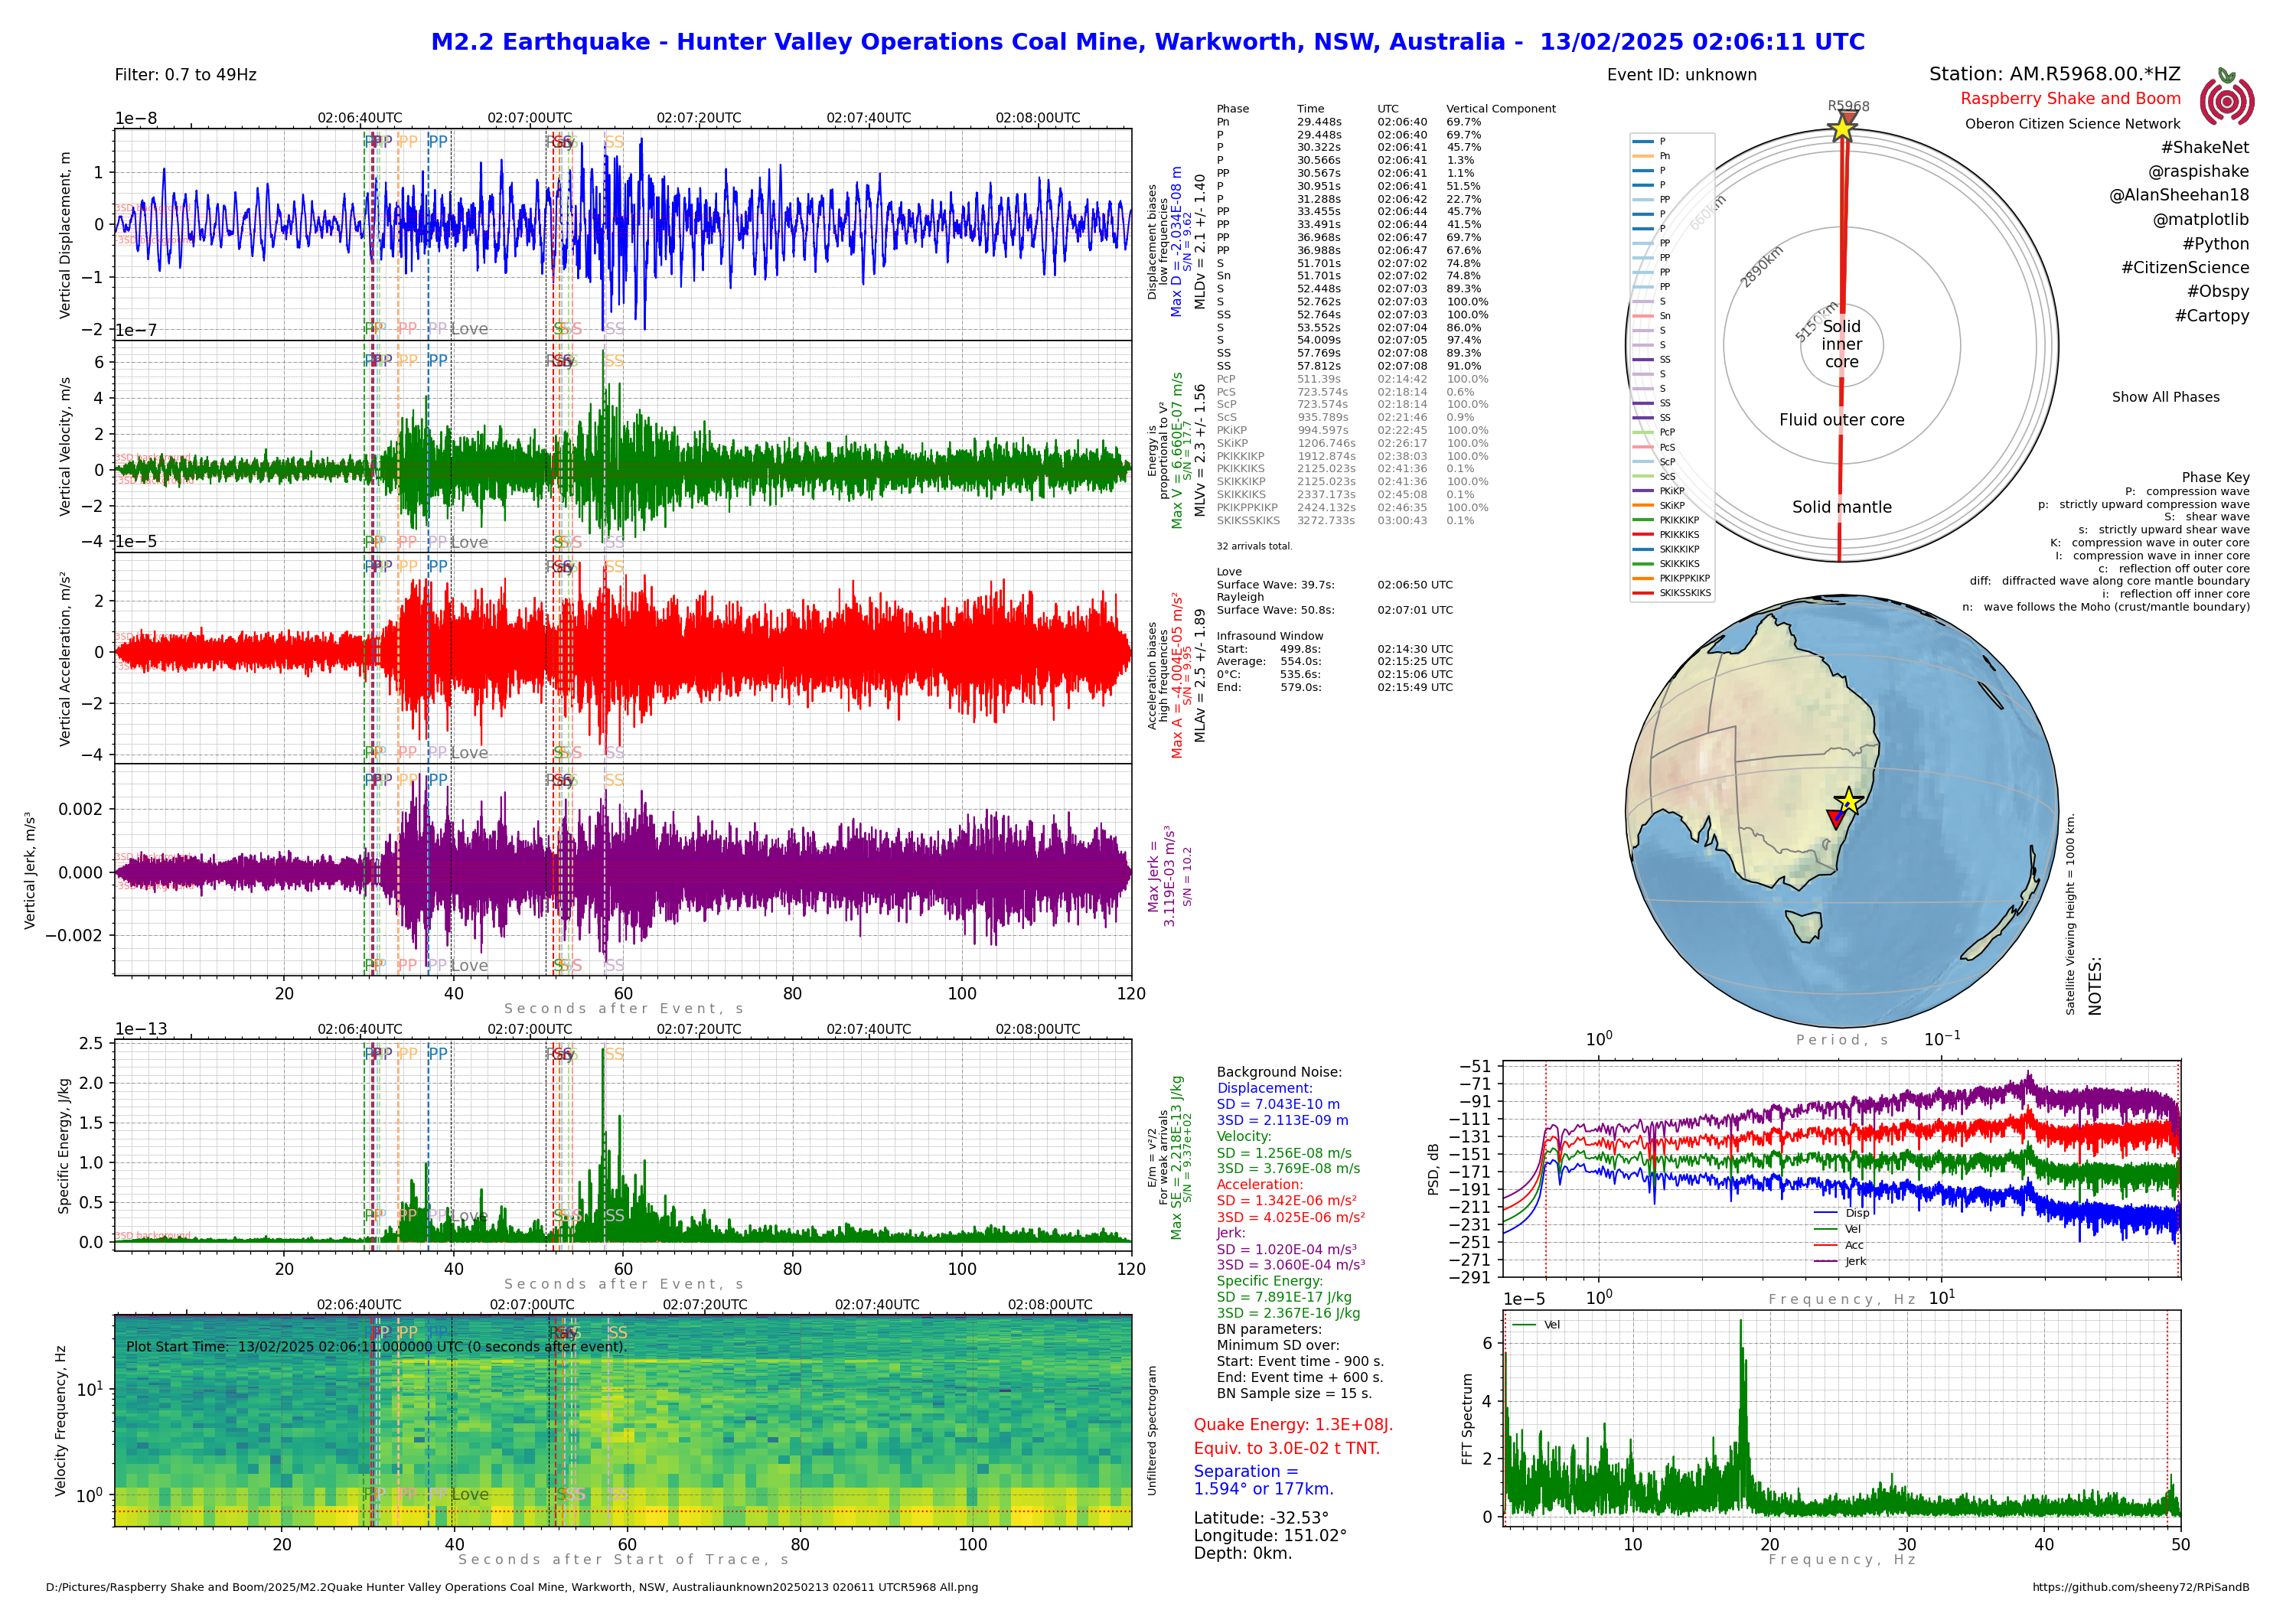
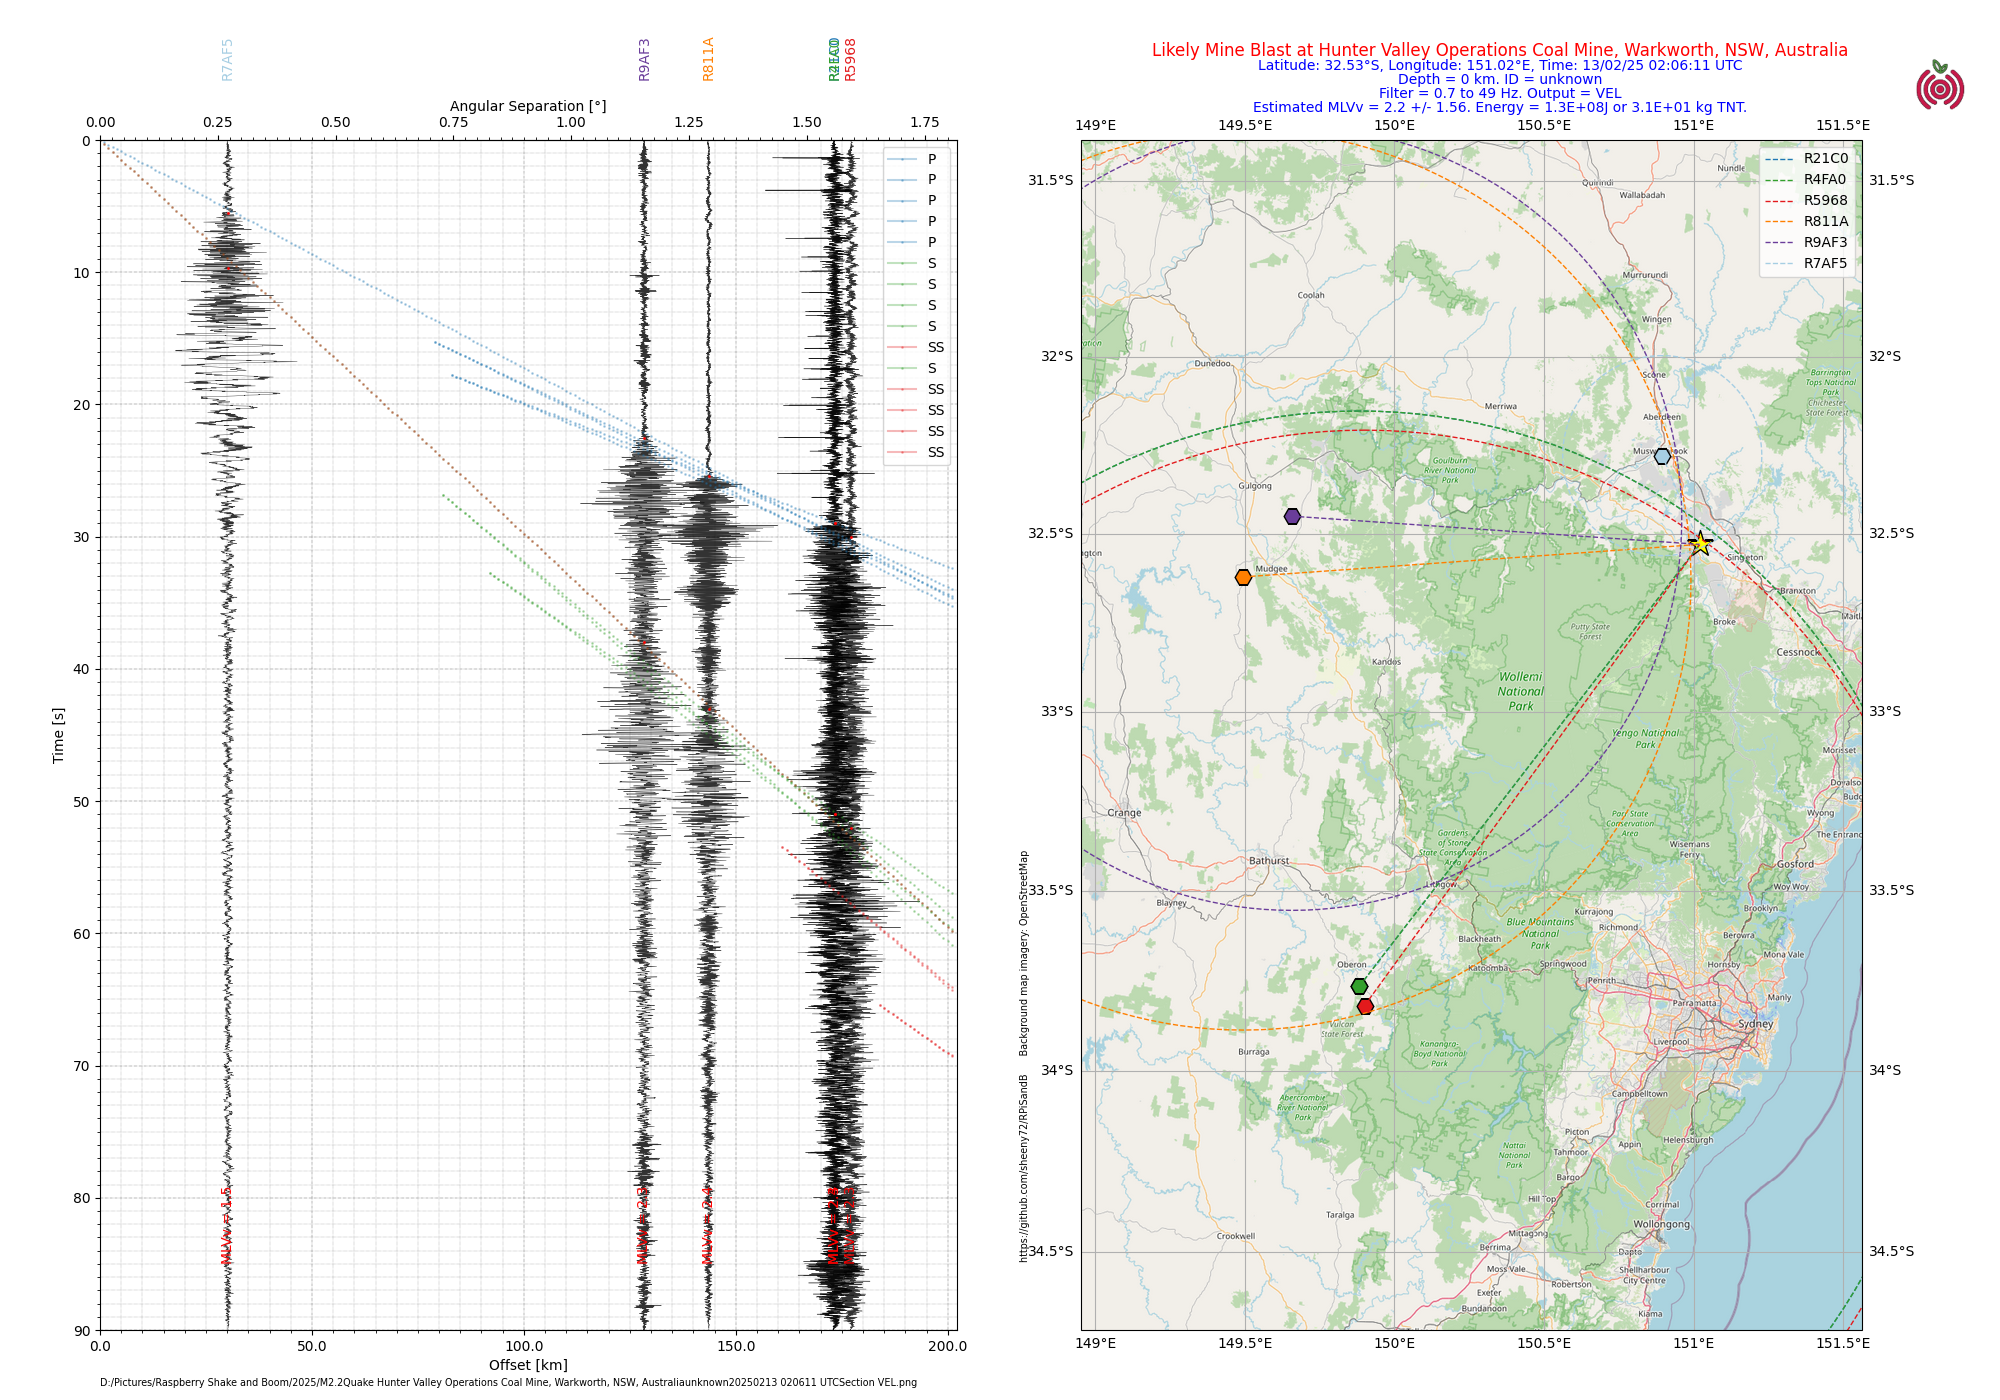
This example shows a routine blast at Hunter Valley Operations Warkworth Mine (best fit location). The blast is equivalent to a M2.2 (+/- 1.56) earthquake. The energy of the blast is about 130 MJ or equivalent to 31kg of TNT (=/- 71%). If you look at the Fast Fourier Transform (FFT) Spectrum plot for station R5968 you will see a strong peak at 18Hz. This is the signal from a detonation interval of 0.55s between individual waves of charges being detonated.
The skills and techniques used in detecting and locating mine blasts help in locating small local earthquakes, and very occasionally an earthquake that has been dismissed as a mine blast.
Thunderbolts and lightning (very, very frightening me…)
Raspberry Shake and Boom stations can be used to investigate lightning. Lightning produces a lot of infrasound (thunder) as a result of the sharp expansion of air heated to plasma instantly by the lightning bolt.
The volunteer organisation Blitzortung.org operates a global network of lightning detectors and produce real time maps of lightning strikes which most people are quite familiar with in many weather apps these days. Their own map site, https://www.lightningmaps.org/, provides accurate timing for lightning strikes.
With the accurate timing of the strike and a Raspberry Shake and Boom, a number of things can be determined about the lightning strike. Note that lightning is never a straight line - it zig zags through the atmosphere finding the path of least resistance.
With accurate strike timing the distance of the closest approach of the lightning bolt can be calculated from the infrasound arrival time at the Raspberry Shake and Boom. Once the distance is known, the infrasound power at the source (lightning) can be calculated (it is really an estimate, because it has to be assumed to be a straight line). A more powerful infrasound power source indicates a more powerful lightning strike.
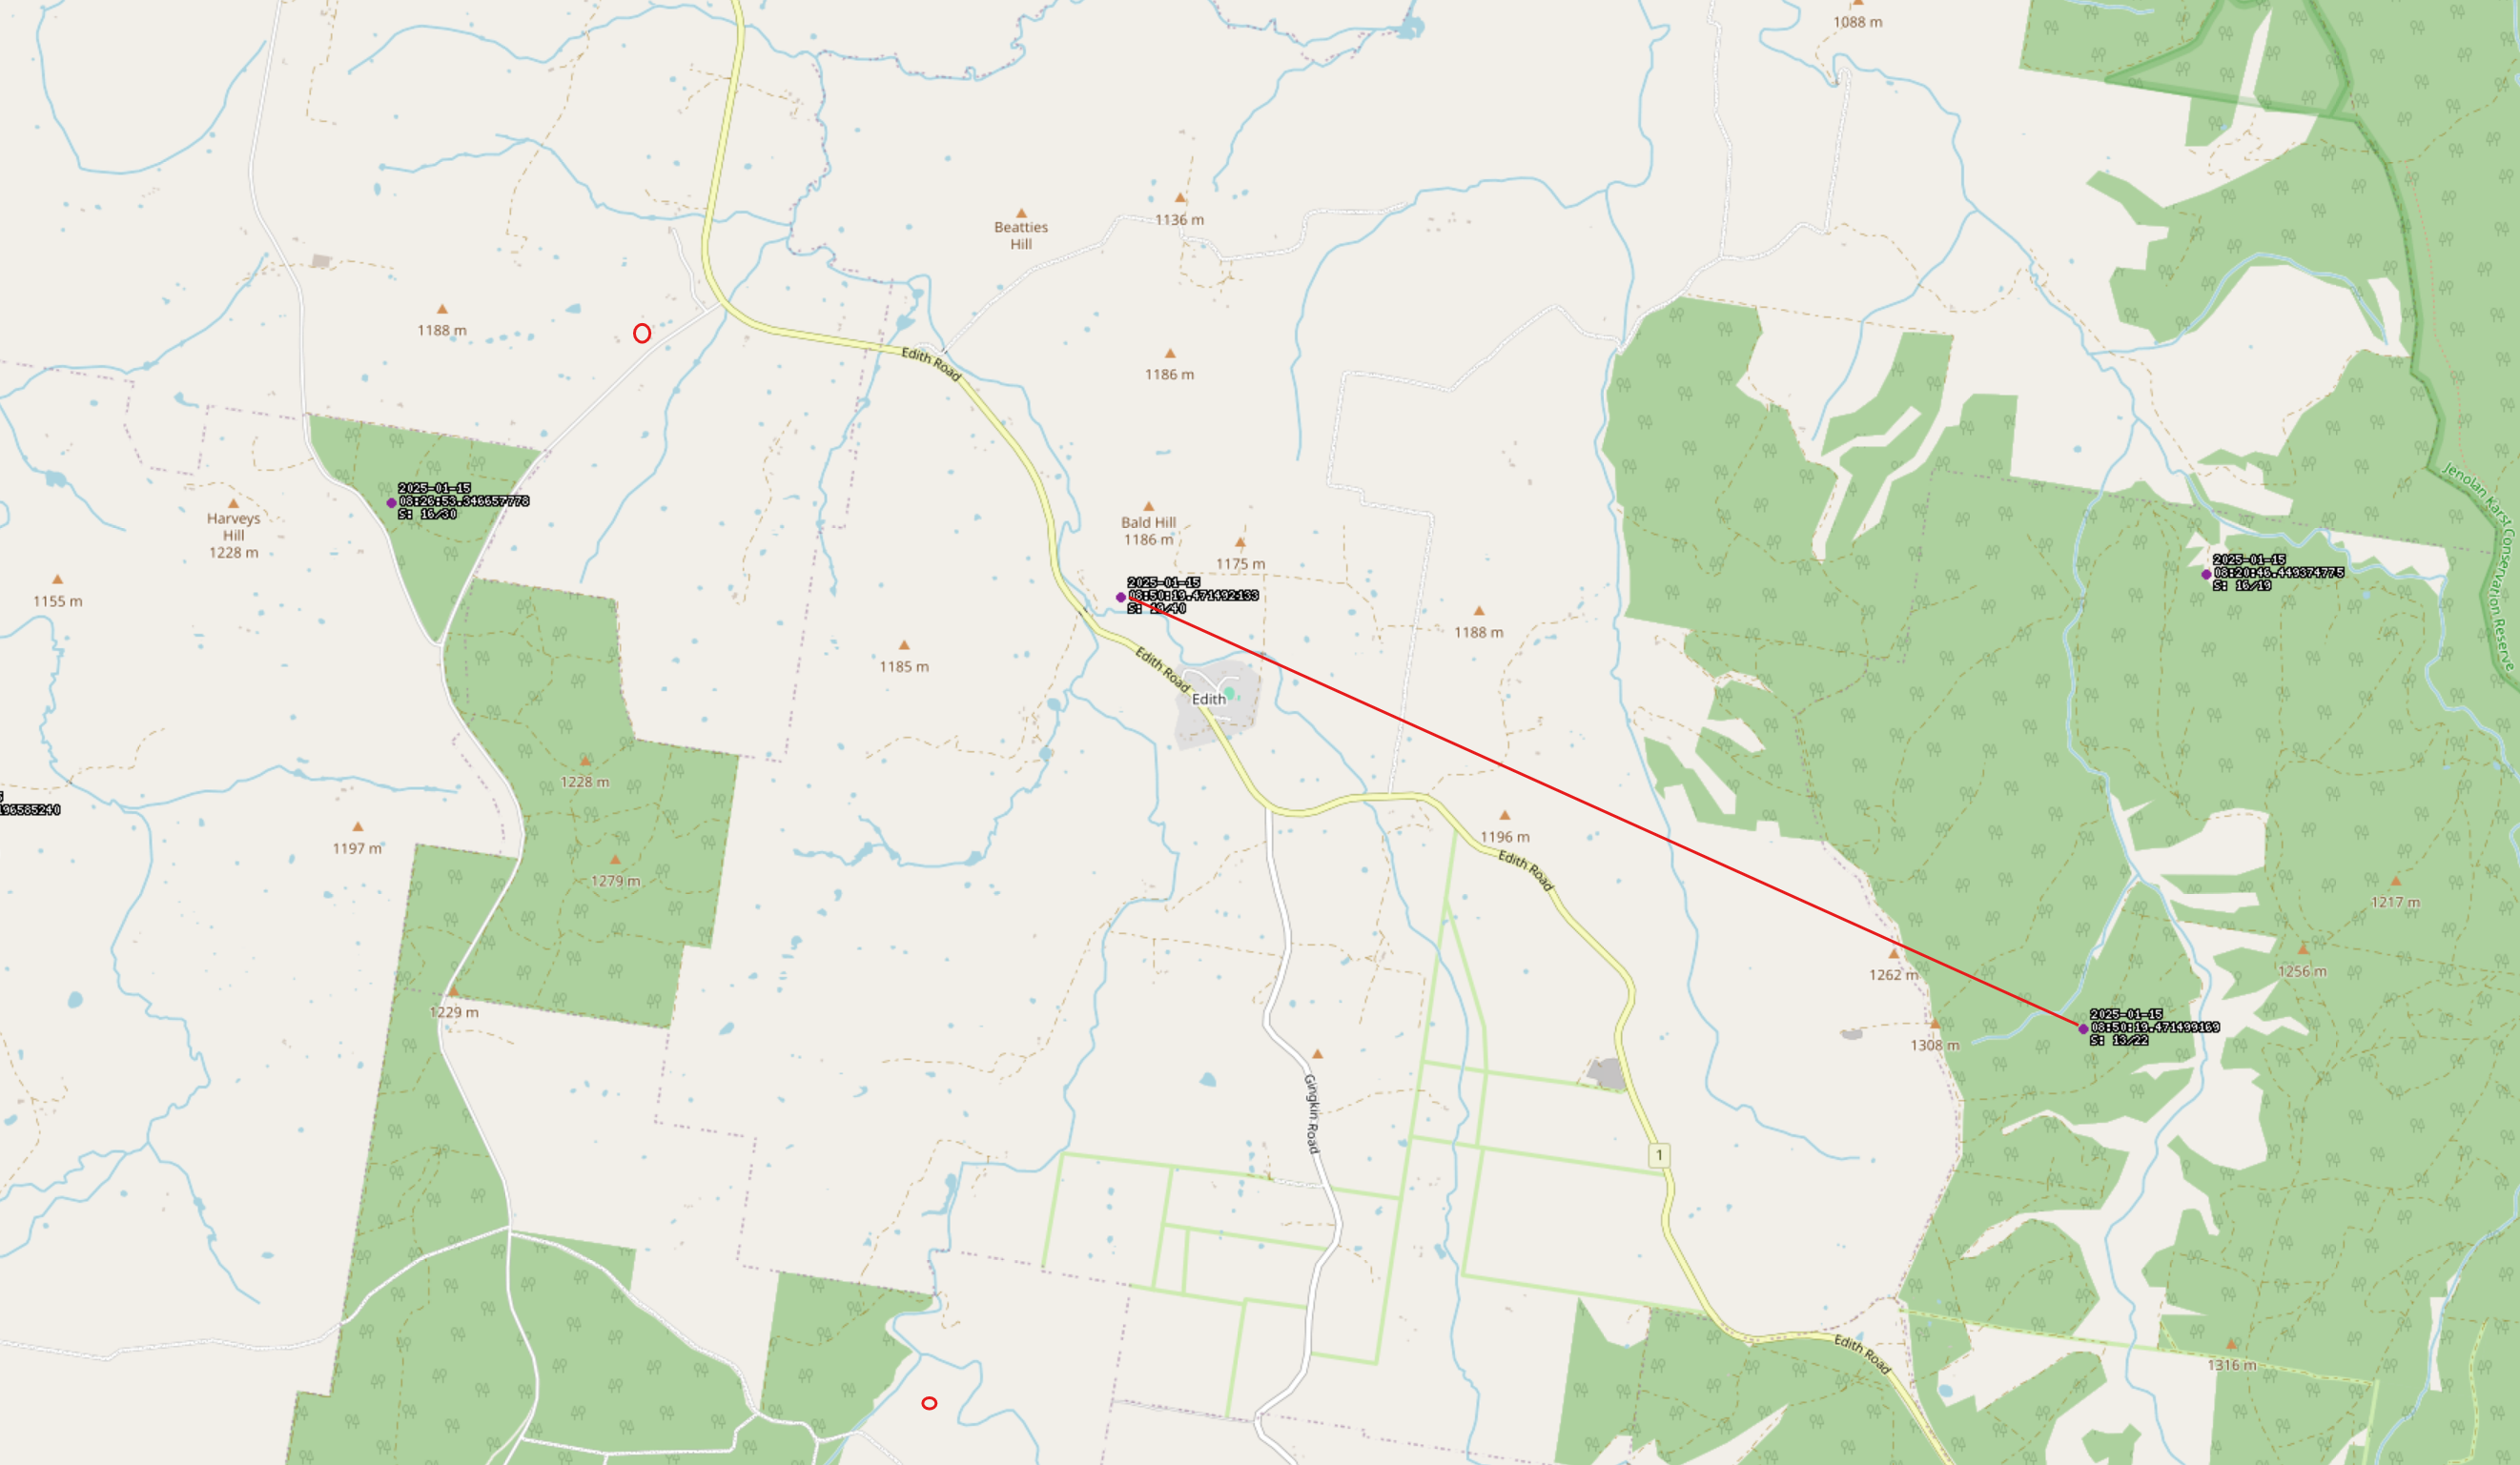
In the map below, the red line links two points of the one strike as captured on the OCSN Raspberry Shake and Booms. Each point if the average location for that strike from a group of lightning detectors. The lightning strike is actually between and around these two points. The Raspberry Shake and Booms can be used to calculate how close the strike got to their locations.
Meteorite and space debris sonic booms
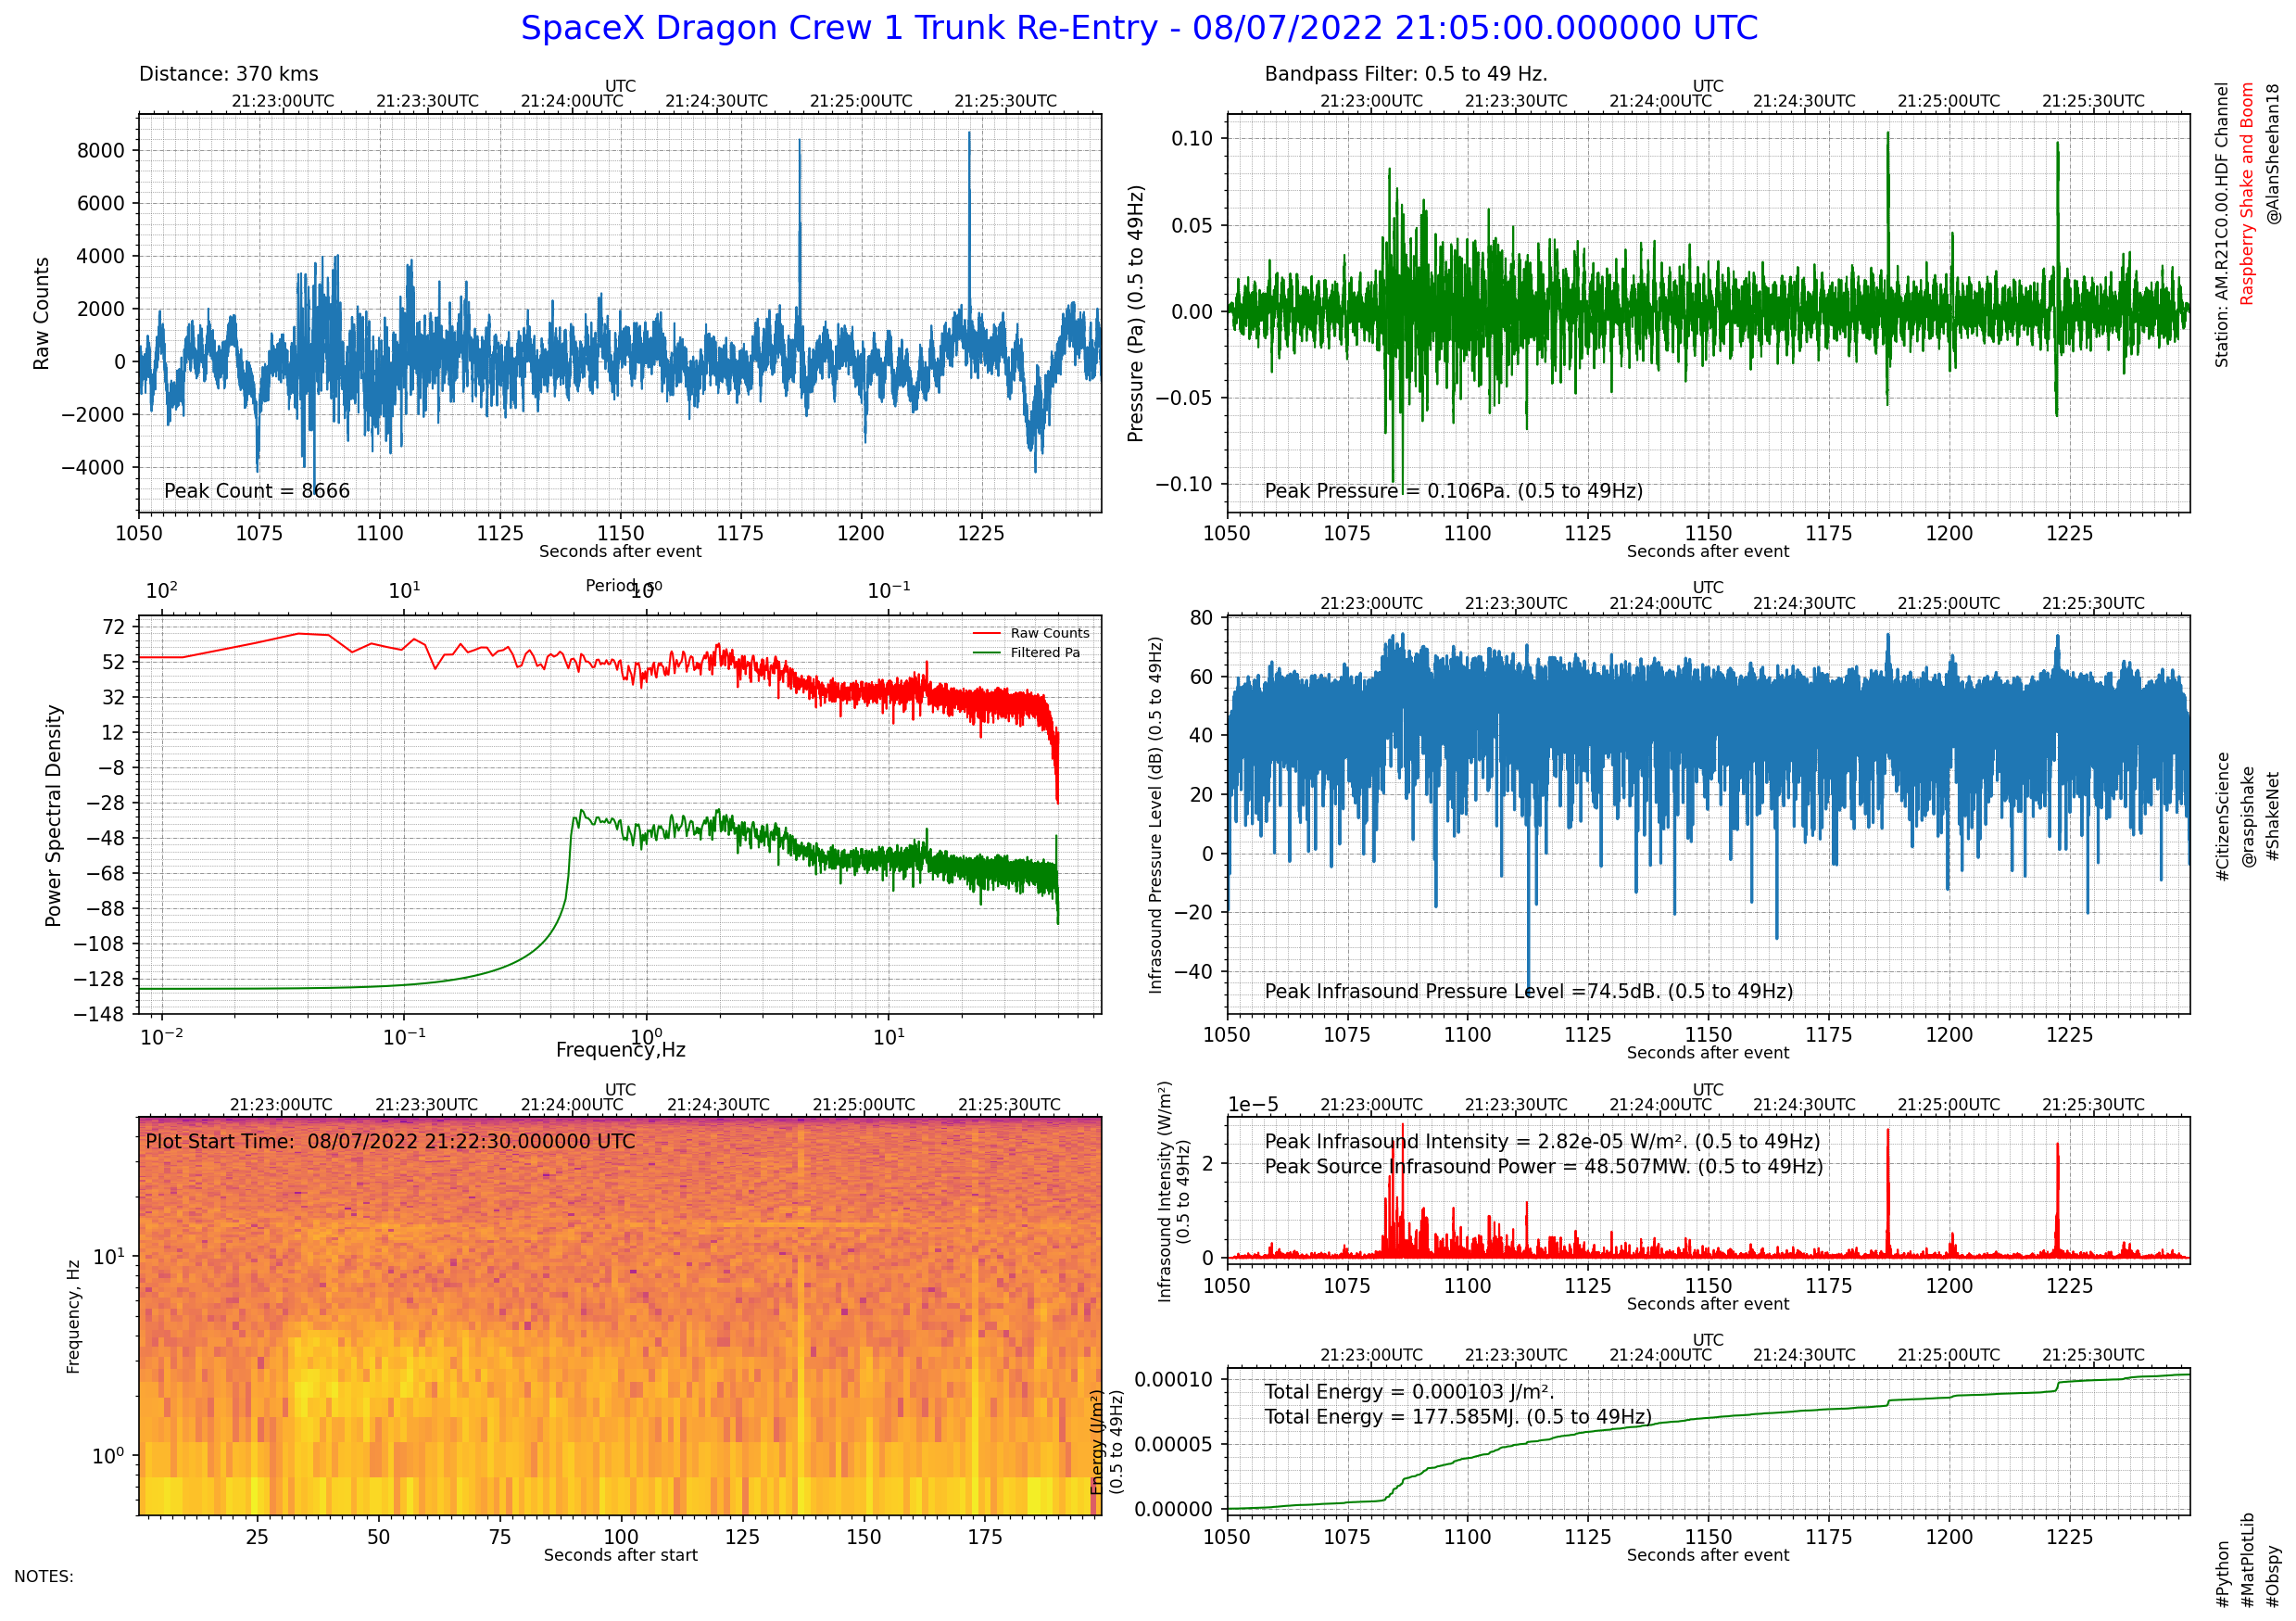
Meteorites and space debris enter the Earth’s atmospshere at supersonic speeds, creating sonic booms from the resulting shock wave. On the morning of August 9, 2022 at 7:05am the SpaceX Crew 1 Dragon Trunk re-entered the atmosphere over Western NSW, the Snowy Mountains and eastern Victoria. This is the infrasound signal of that event captured on a Raspberry Shake and Boom operated by Alan Sheehan just outside Oberon, some 370kms away from the point of closest approach.
DIY data analysis
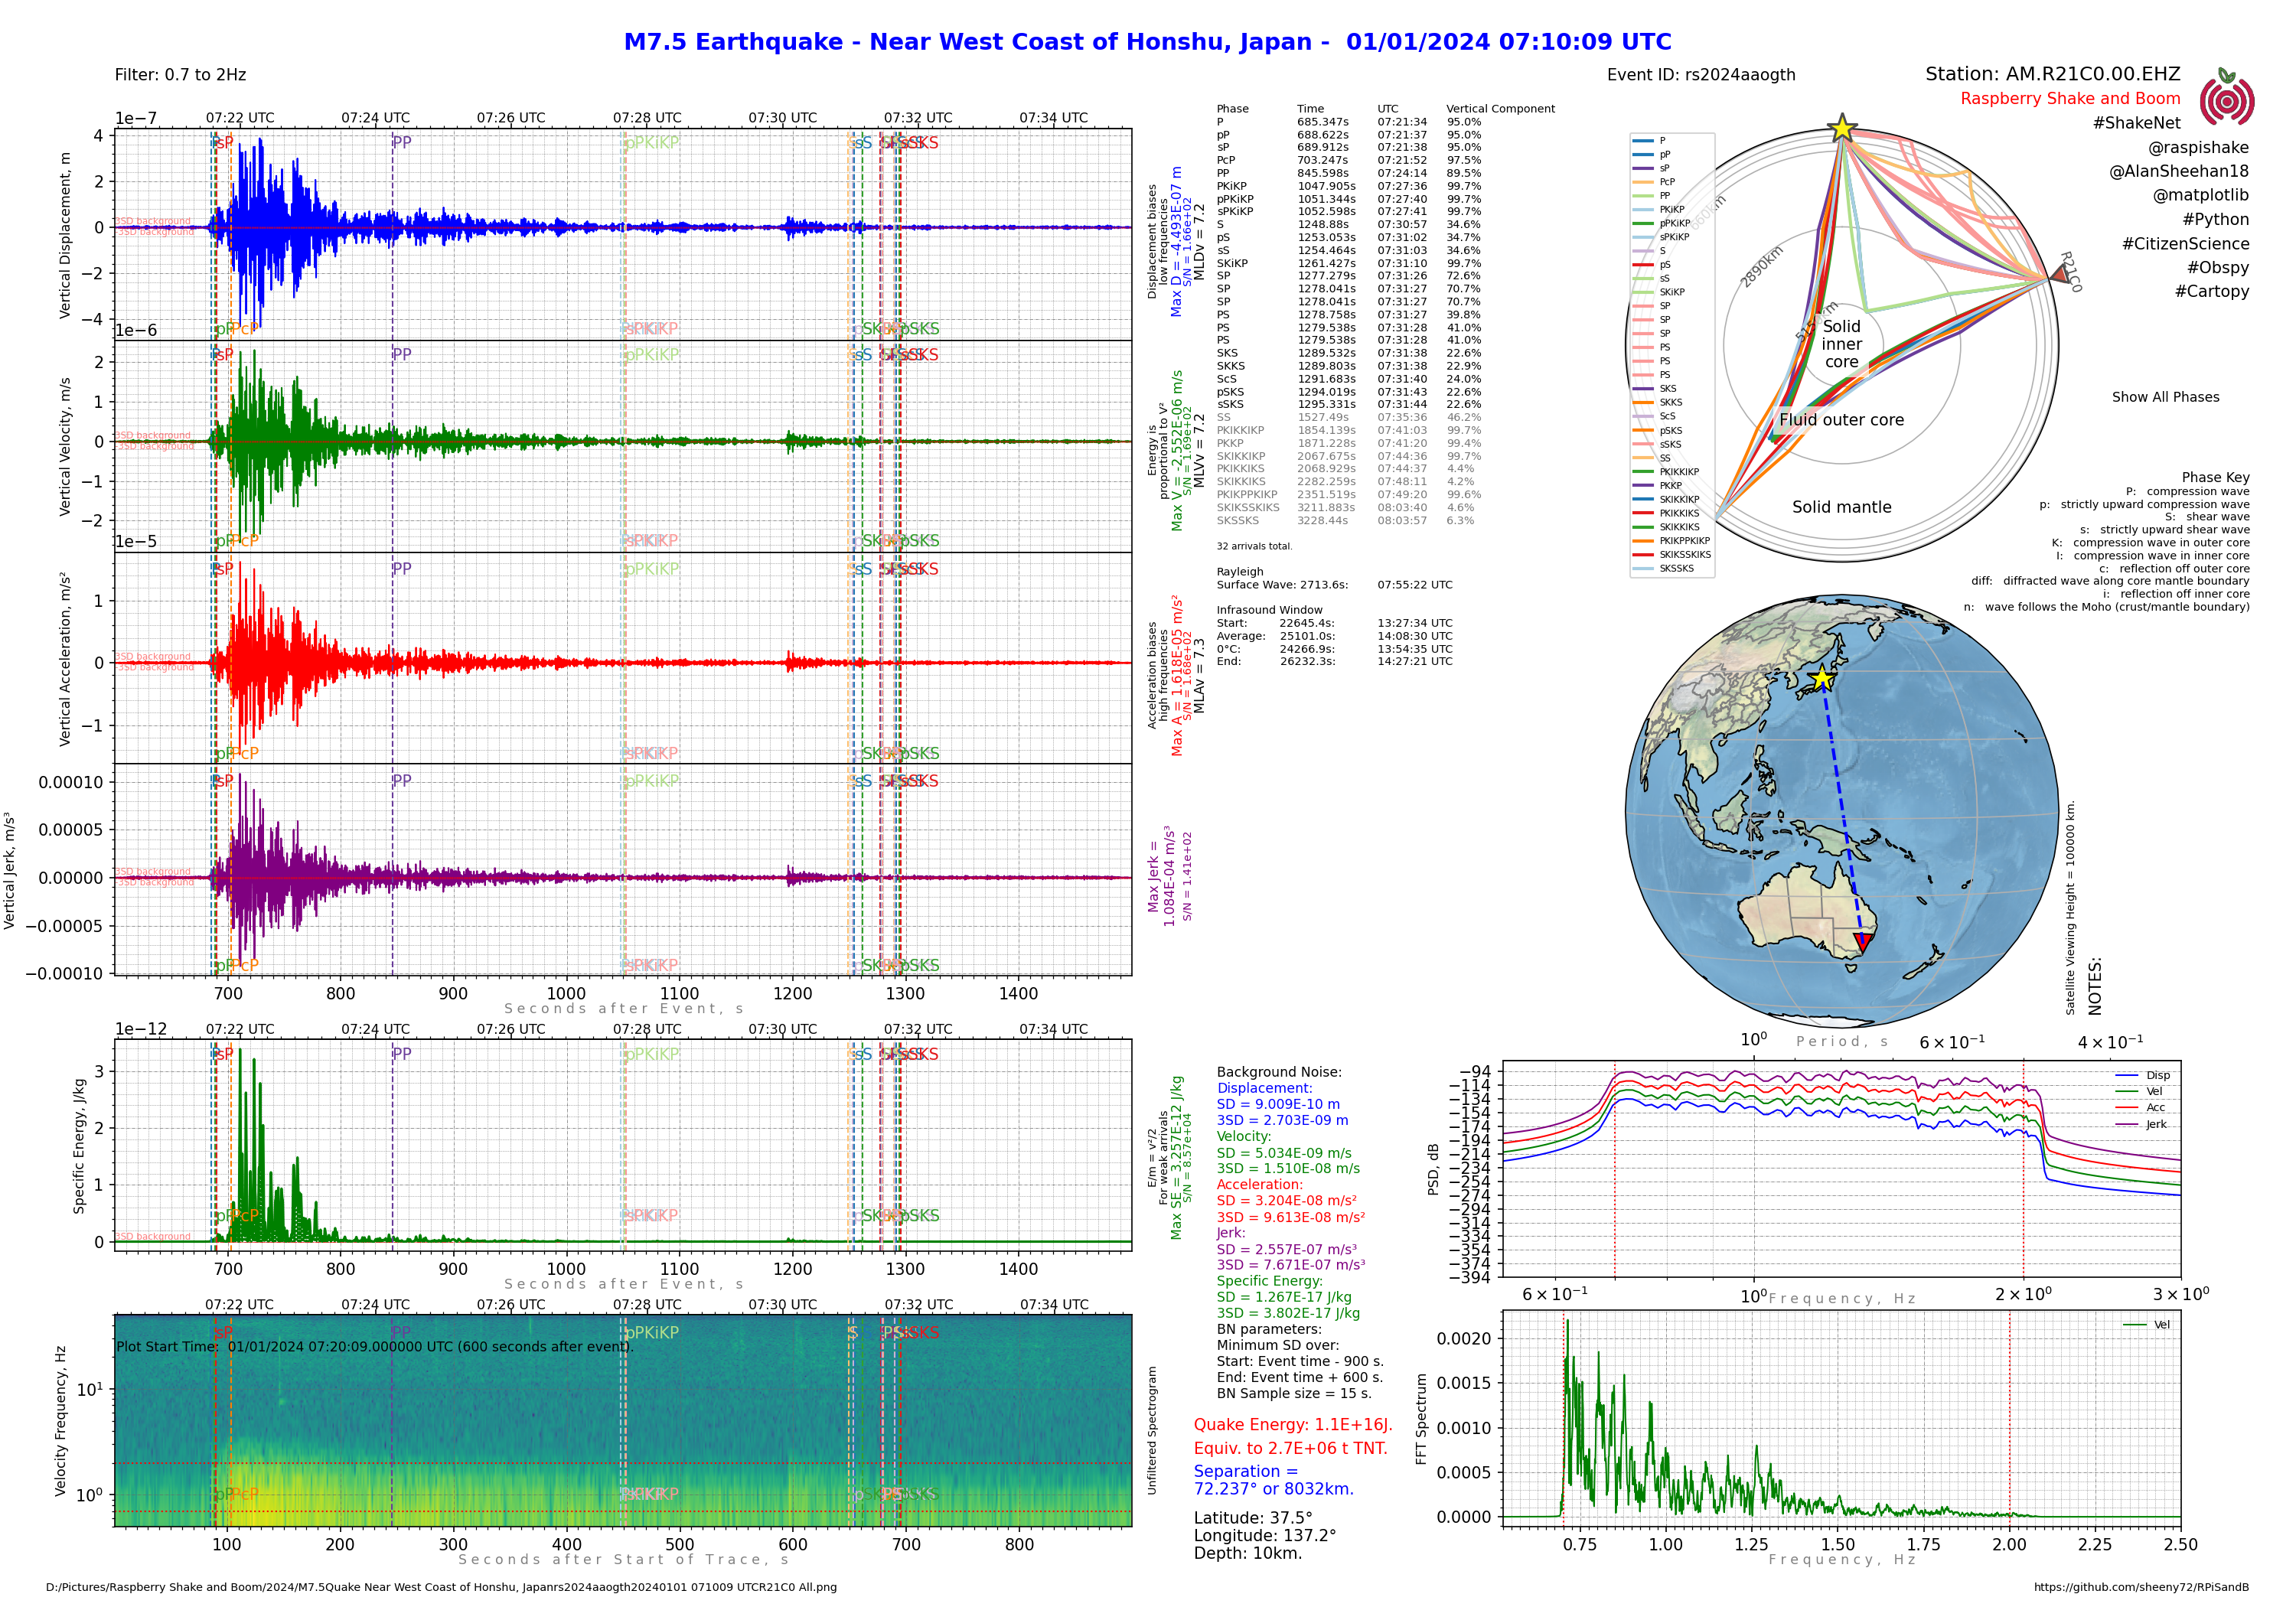
With a little program code, using the Python programming language, you can fully explore the capabilities of your Raspberry Shake and Boom. Don’t worry - we are happy to share code and help you to learn how to do it. Shown below is a custom analysis of an earthquake in Honshu, Japan, programmed by Alan Sheehan.
More on infrasound
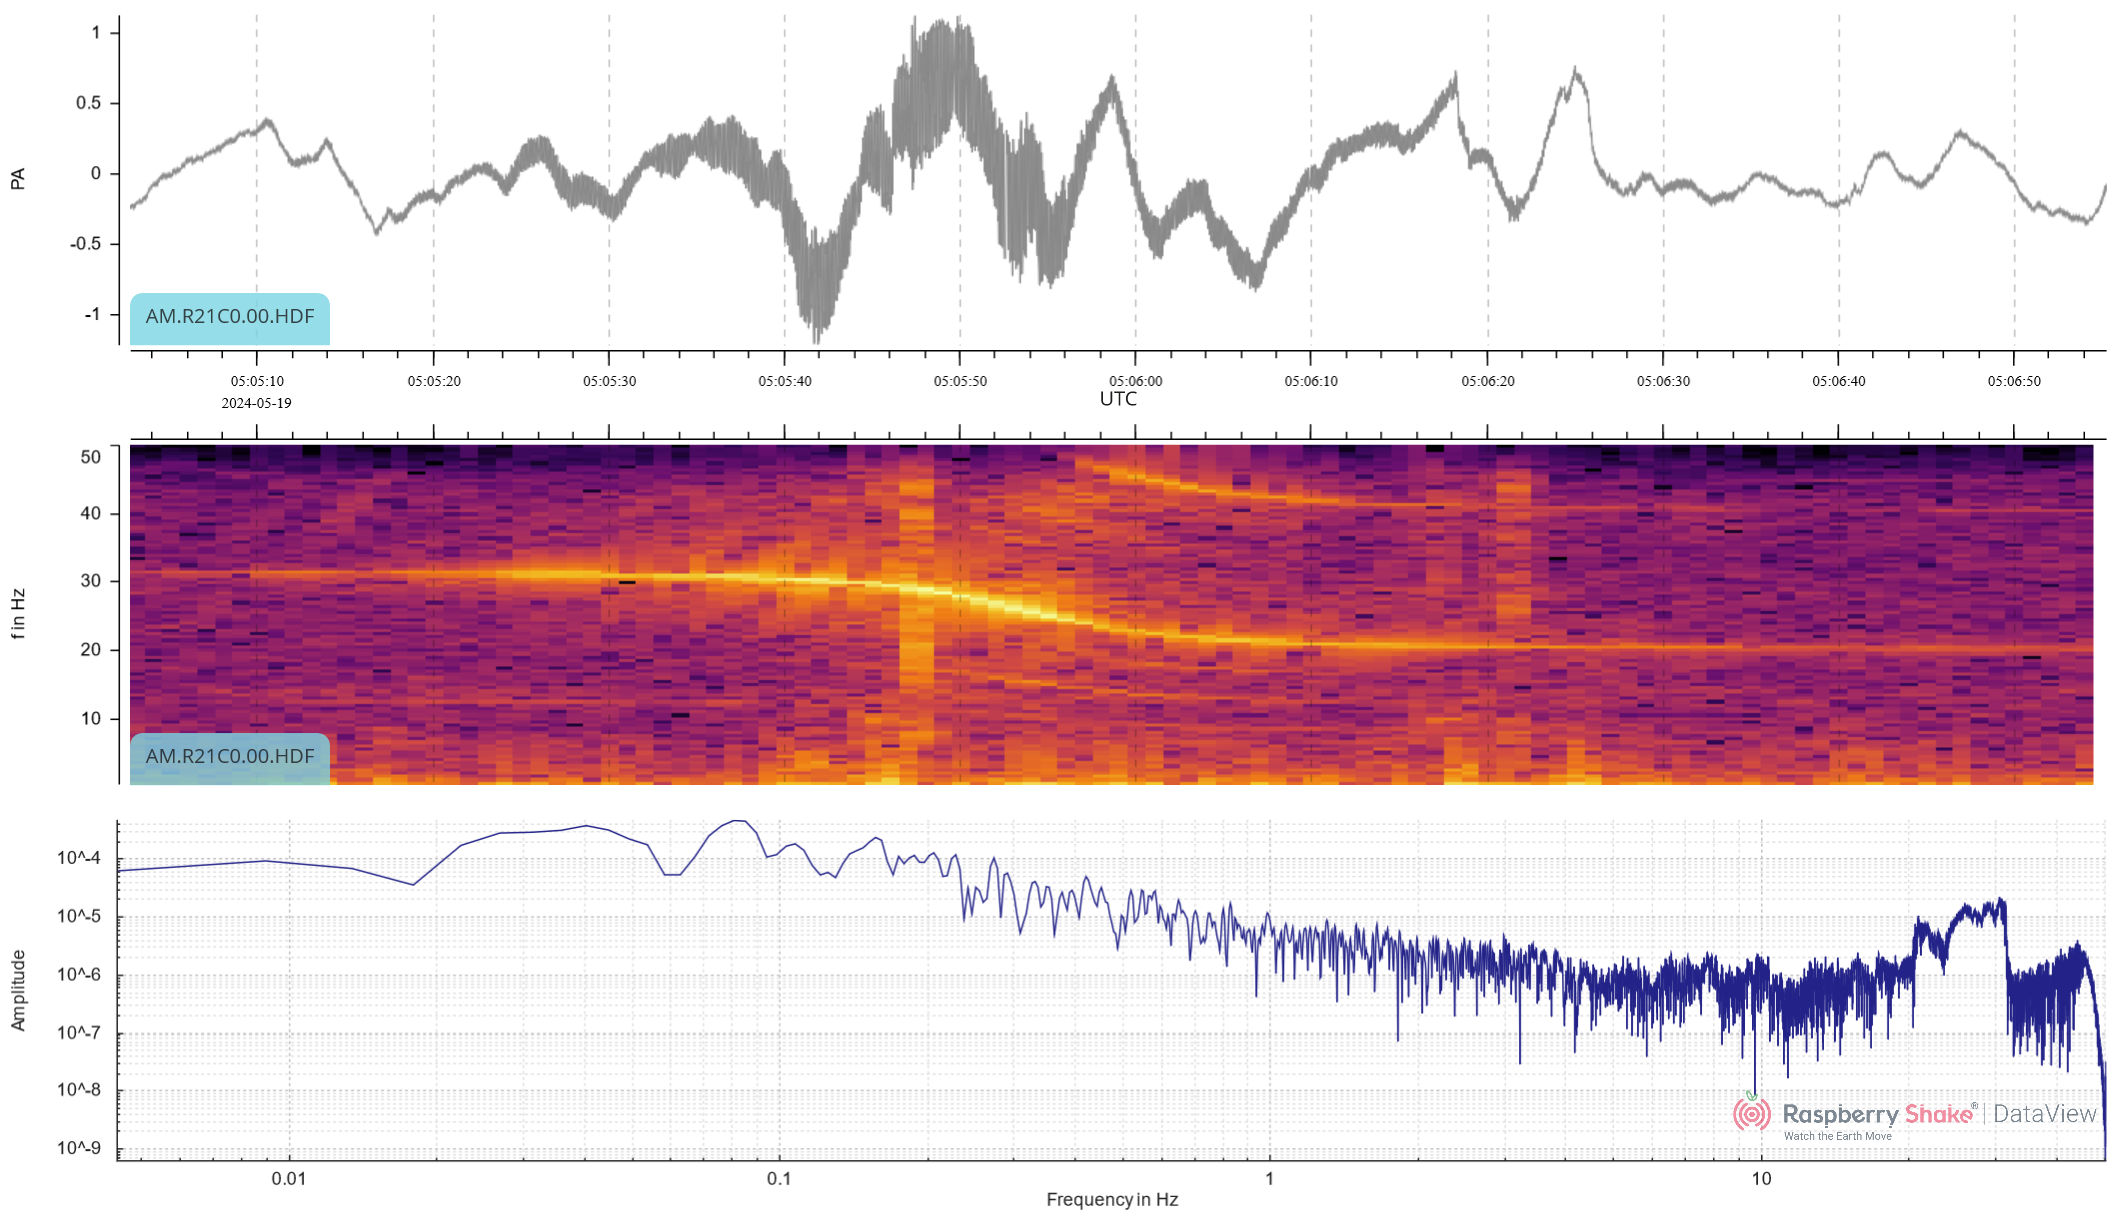
Below is the infrasound signal of a passing helicopter, showing the Doppler shift in frequencies as it first approaches then receeds from the monitoring Raspeberry Shake and Boom device. You don’t need any coding skill for this type of report either - its available from the Raspberry Shake Data View web app and you can join and use any or all the Raspberry Shakes in the world for free (you don’t even have to own one!), via the ShakeNet web site.
Wind turbine infrasound
It should be born in mind that merely detecting infrasound generated by wind turbines does not necessarily imply that that infrasound has impacts on human (and/or non-human) health, or even that humans and other animals can detect it. Nonetheless, we beleive that it is important to develop capabilities to monitor such artifical sources of infrasound, as well as natural sources such as wind blowing through trees and sound generated by fast flowing water in river rapids, and to collect baseline data before any proposed wind turbines are constructed, as well as after they become operational. OCSN also intends to undertake a meta-review of articles and reports which review and summarise the scientific evidence around the effect of infrasound on human health and the broader ecology.
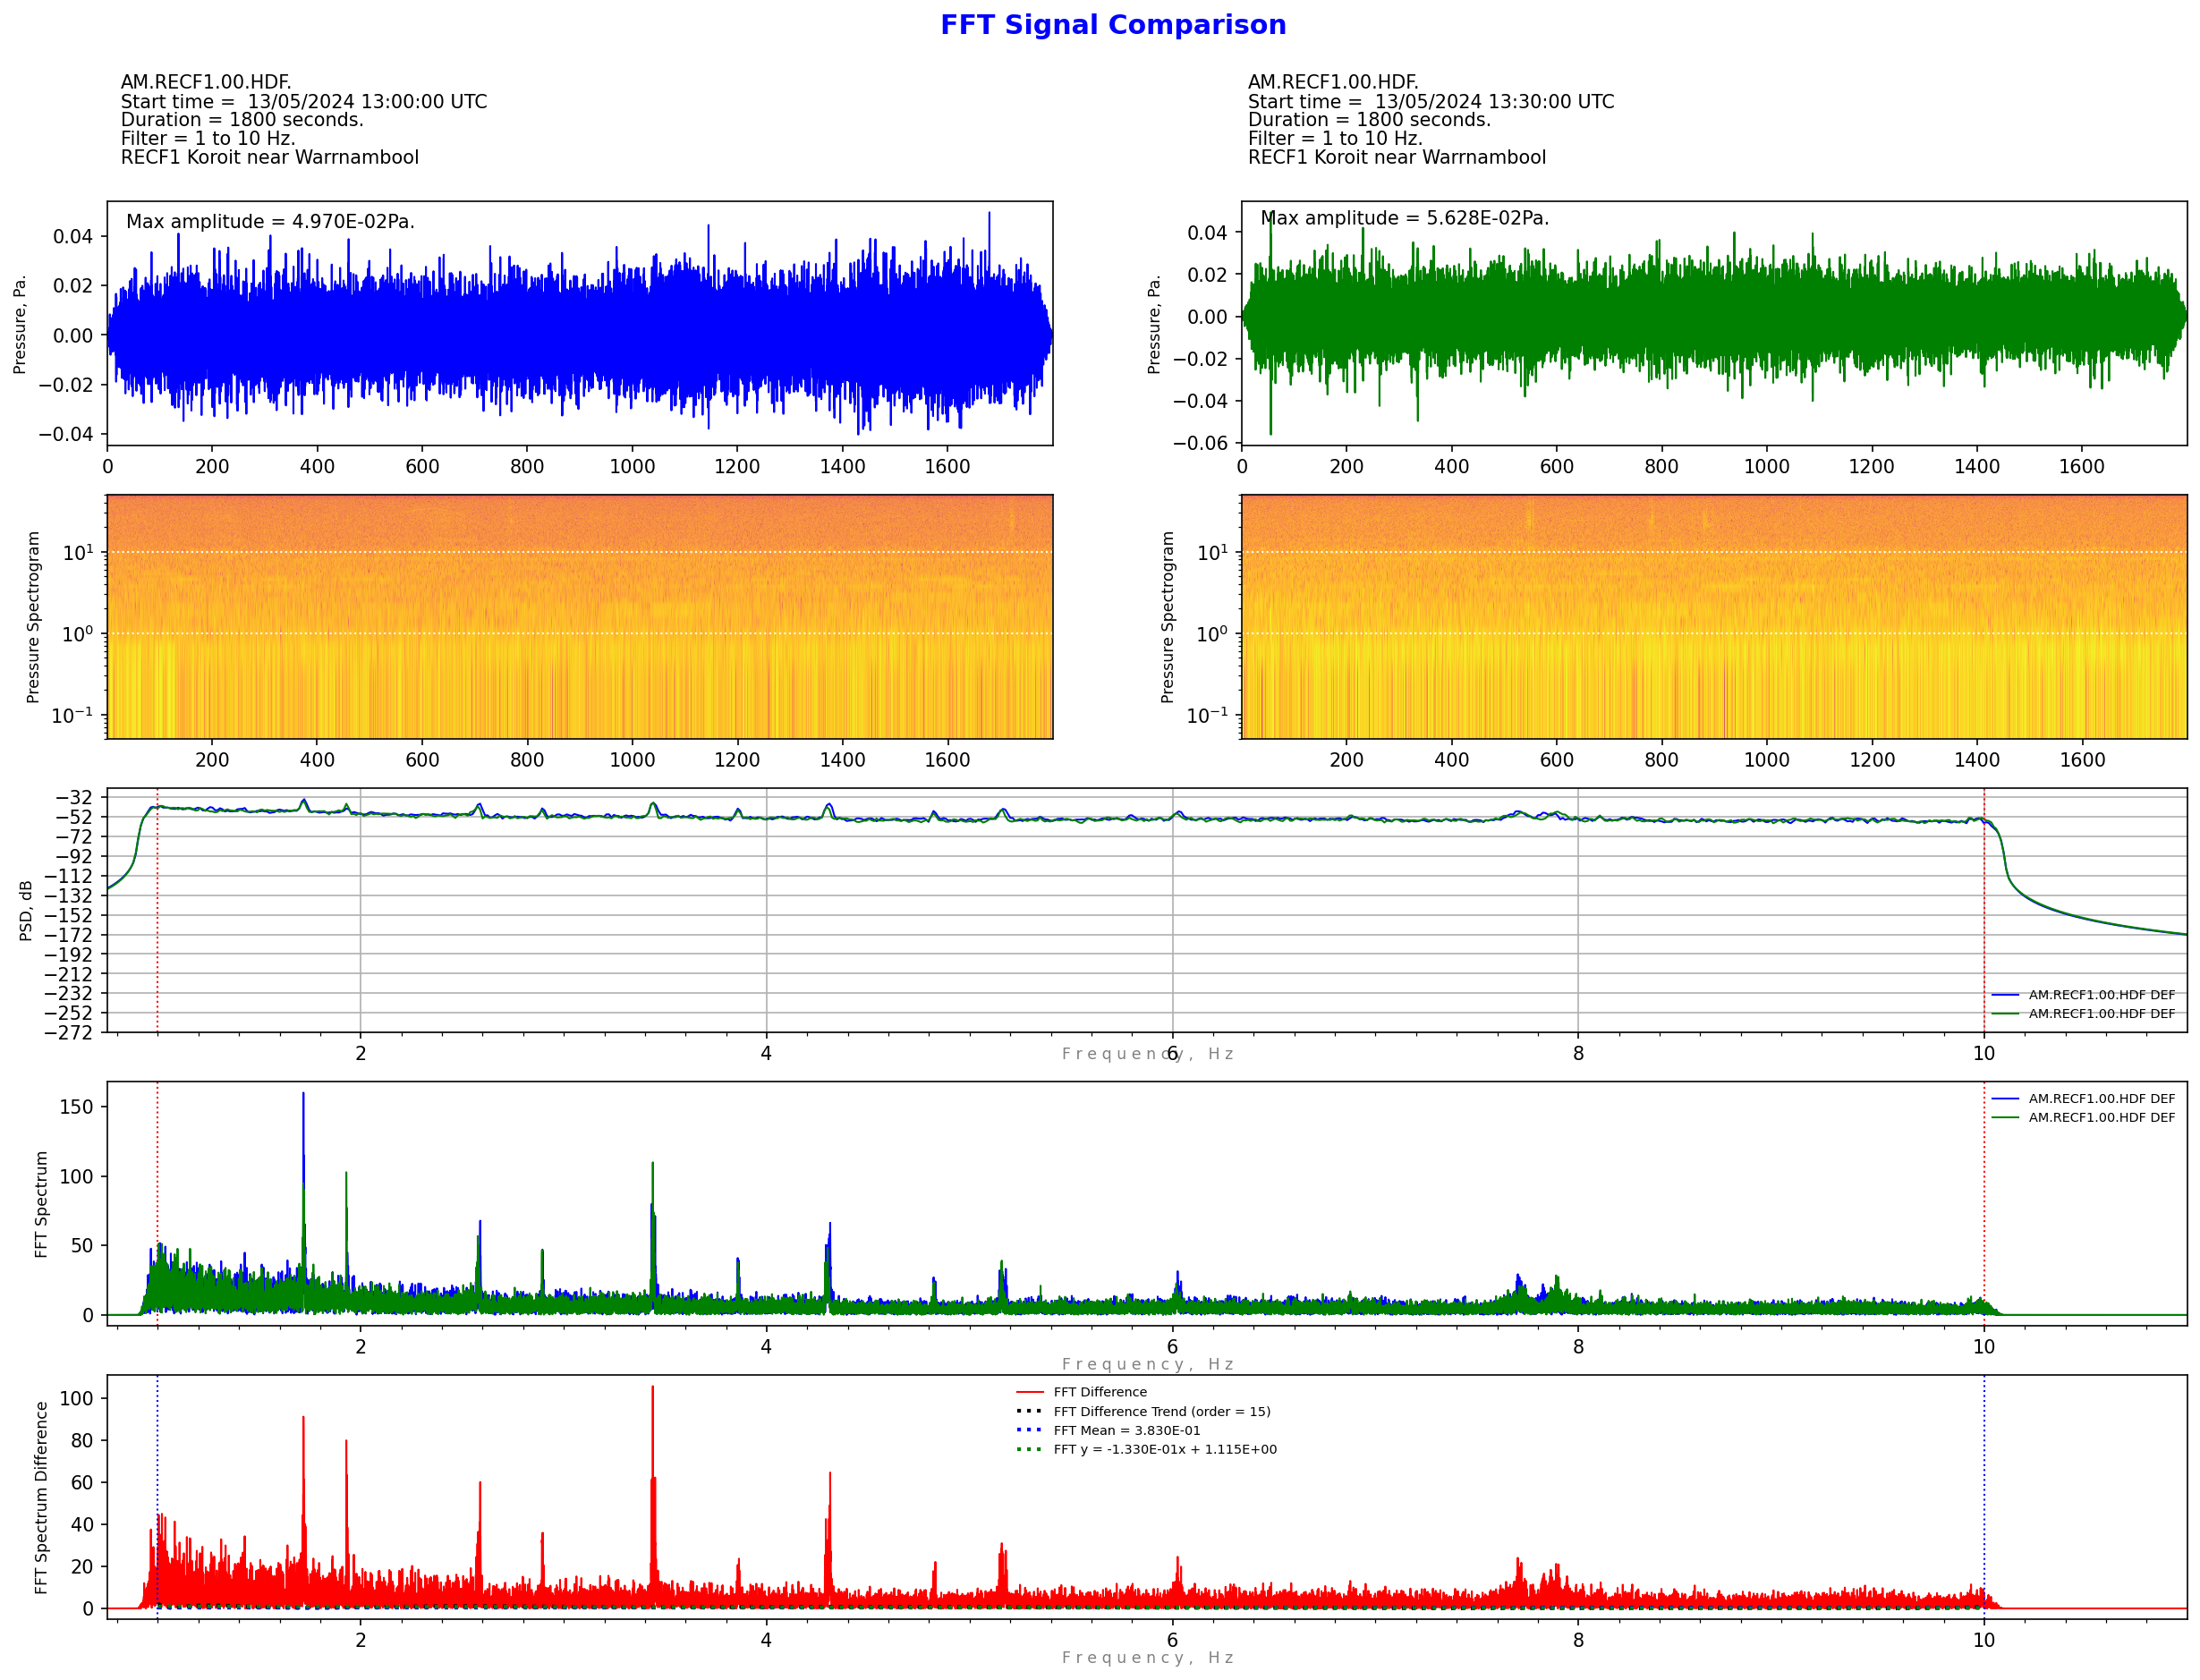
The infrasound microphone in the Raspberry Shake and Boom device should be able to detect infrasound generated by wind turbines. Not much work has been done yet to fully investigate and validate these capabilities, and further investigation of this will be one of the initial projects to be undertaken by OCSN. However, if the infrasound data from a Raspberry Shake and Boom deployed at Koroit, which is near Warrnambool in Victoria and close to several large wind farms, is processed using a Fast Fourier Transform (FFT), some interesting features become evident in the resulting spectrograms. We suspect the spikes in the FFT spectrums shown below are tonal frequencies from laminar boundary layer, blunt trailing edges and/or flow over holes, slits and intrusions in nearby wind towers. It shows the potential capability of the RSnB to continuously monitor infrasound generated by wind turbines at a range of distances, although this very preliminary work still needs to be carefully validated.
Hosting a Raspberry Shake & Boom
If you are interested in hosting your own Raspberry Shake & Boom, please register you interest in joining OCSN via the web form available via the expressions of interst page, and note that you are interested in hosting a Shake & Boom. At this stage all Shake and Boom devices need to be self-funded, although we will be seeking funding to subsidise or fully cover the costs involved.