Warning
The viewshed maps on this page are very detailed and may take quite a while to display in many web browsers, and may not render at all on small devices such as smartphones or tablets. They are provided purely for development purposes, and final versions will be optimised for faster display.
Introduction
The ability to assess the visual impact of proposed wind farm developments is important for several reasons:
- current wind turbines are very large structures which are potentially visible over large distances;
- they are moving industrial structures in, typically, otherwise rural settings devoid of other large man-made structures;
- the movement of wind turbines tends to attract the eye, further increasing their prominence in the landscape;
- if measures of visual impact can be calculated for different proposed configurations of wind turbines (location, number and size of each turbine), then better planning decisions can be made to minimise their visual impact, and/or their visual impact can be appropriately assessed with respect to other potential benefits and disbenefits;
- wind farms tend to be controversial developments, which can create considerable conflict in local communities and which may be subject to lobbying and public opinion campaigns, both for and against – these campaigns may not use principled or reliable information which has been created using documented, verifiable and reproducible scientific processes – and this there is a valid rôle for independent bodies such as OCSN to develop visual impact assessment capabilities; and
- the visual impact assessment procedures set out in government guidelines and typically carried out by consultants hired to undertake such assessments on behalf of wind farm developers do not necessarily reflect recent research into better methods of undertaking such assessments.
The aim of this series of blog posts is to document the initial steps by OCSN members in developing visual impact assessment capabilities which address these issues in order to provide state-of-the-art, reproducible information for the local community and other stakeholders.
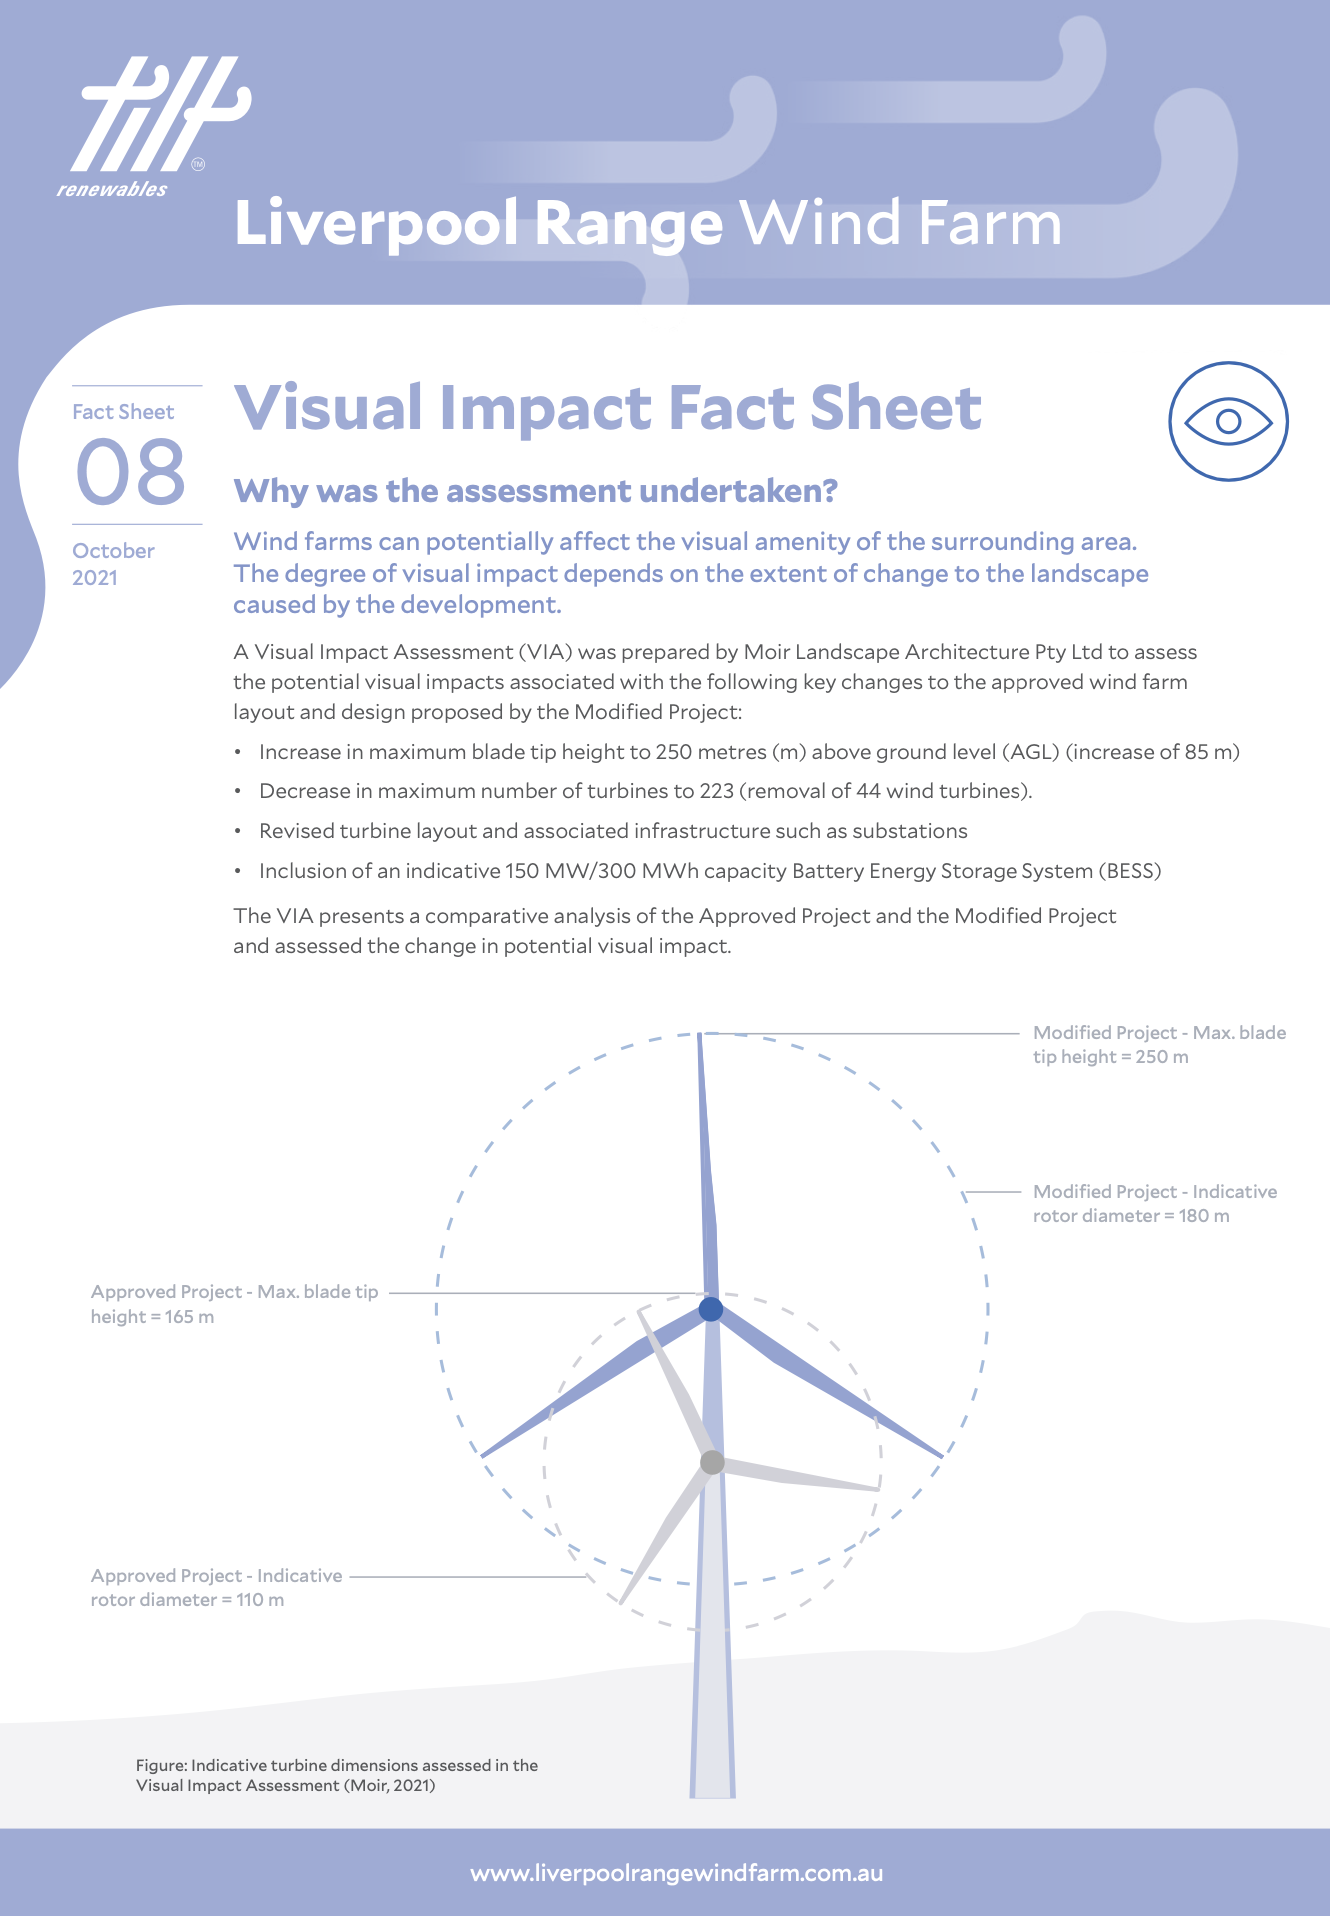
A typical visual impact assessment fact sheet to inform the local community, this one for the NSW Liverpool Ranges wind farm (click image to open the document):
Visual impact assessments
Typically developers of wind farms proposals commission specialist agencies to provide such visual impact assessments on their behalf, both to inform the local community and other stakeholders, and for inclusion in the EIS (environmental impact statement) and associated documentation required by planning processes. These visual impact assessments are typically use methodologies described in relevant government guidlines, such as the 2016 NSW Department of Planning and Environment Wind Energy: Visual Assessment Bulletin.
Visual impact assessment is a complex, multi-disciplinary subject, involving geometry, physics, earth sciences, psychology and psychometrics, and social factors. These series of blog posts are not intended to be a comprehensive introduction or treatment of the subject – rather, they merely document the development of some visual impact assessment capabilities by members of Oberon Citizen Science Network, which can be used to provide information about the potential visual impact of proposed wind farms in the Oberon region.
Note
The examples provided in this series of blog posts use the locations of 47 wind turbines in the proposed Palings Yard wind farm. However, the size of each turbine has been modelled on the turbine type used in a scientific paper by James F. Palmer Palmer (2022) published in the peer-reviewed journal Landscape and Urban Planning. We will be referring to that paper repeatedly in these blog posts. However, the actual parameters for specific wind farm proposals can easily be substituted and the calculations re-run with minimal effort, and we will do that in due course when exact parameters for the proposed Palings Yard wind farm turbines are known. The number and georgraphic locations of the proposed turbines used here do, however, accurately reflect the information in the 2023 Palings Yard wind farm EIS submission and provided on the Palings Yard wind farm web site.
In due course recent developments in visual impact assessment methods described in other peer-reviewed scientific papers will also be implemented to add to OCSN’s capacity in this respect.
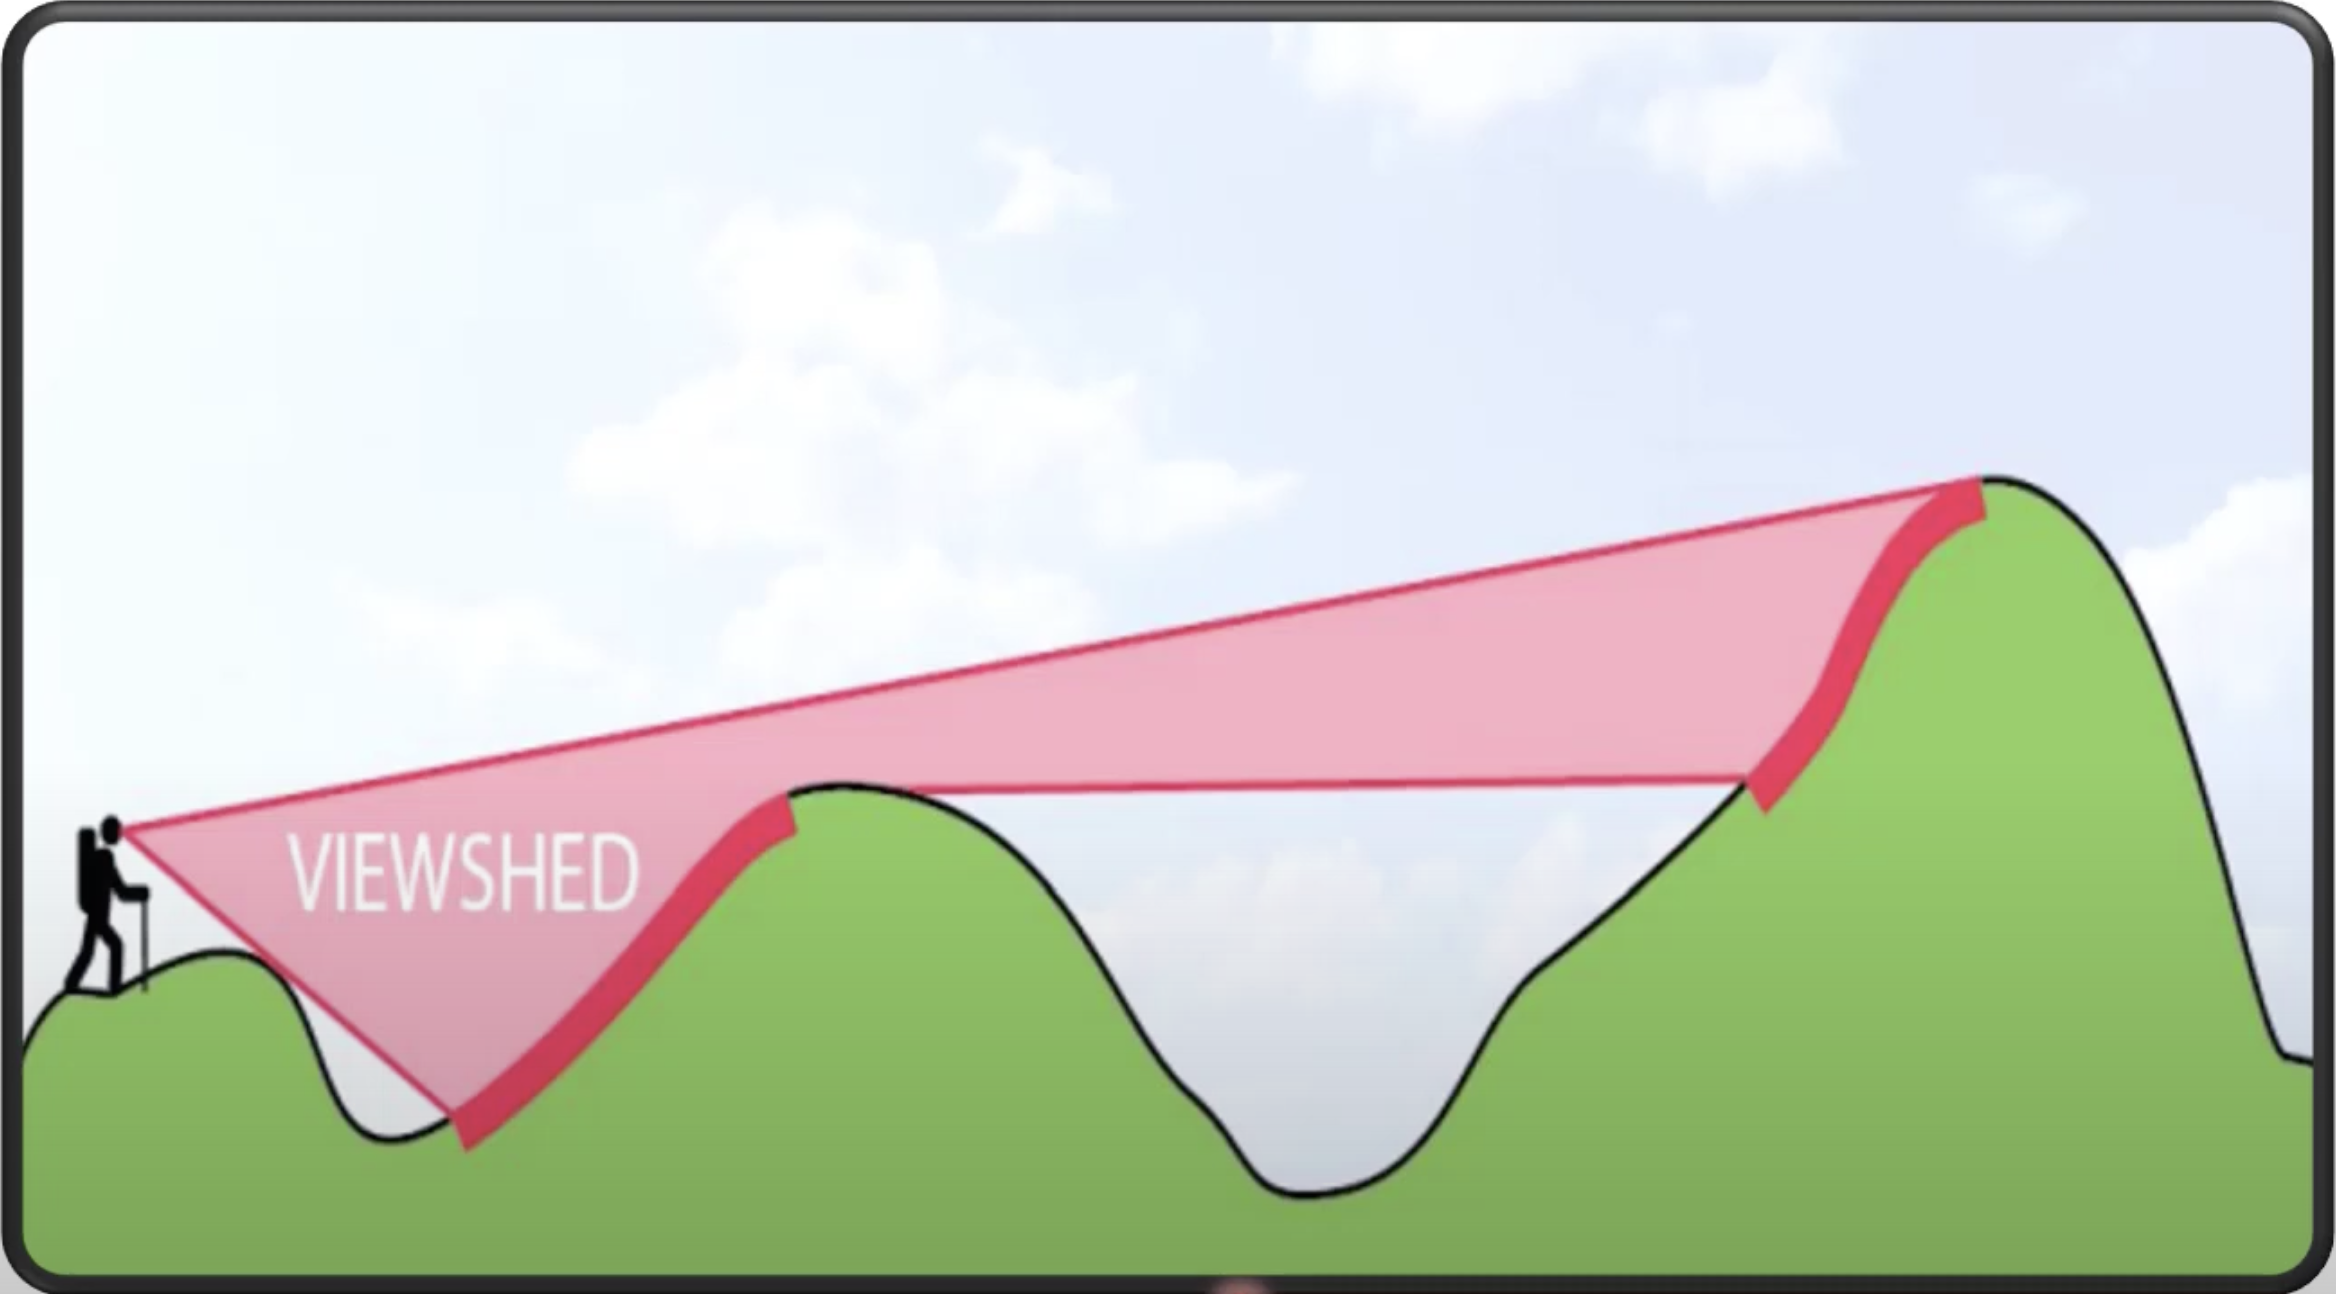
Viewsheds
The most basic type of visual impact assessment is the calculation of the viewshed of a structure. The viewshed comprises all the points in the surrounding landscape which can be seem from the top of (or any point on) a structure such as a building, tower or a wind turbine. If the the structure is a tower used for transmitting radio waves, or an obseravtion tower (such as a fire observation tower), then what can be seen from the tower by direct line-of-sight is of obvious interest.
However, we are usually not very interested in what can be seen from, say, the nacelle (hub) of a wind turbine, let alone from the tips of its blades. But we are interested in which points in the landscape the blade tips, or the nacelle, or indeed the entire span of the wind turbine blades, can be seen. This is called the inverse viewshed or reverse viewshed. In fact, the viewshed and its inverse are symmetrical – if a point in the landscape can be seen from a the top of a tower, then the top of that tower can also be seen from that point in the landscape.
Calculating the viewshed
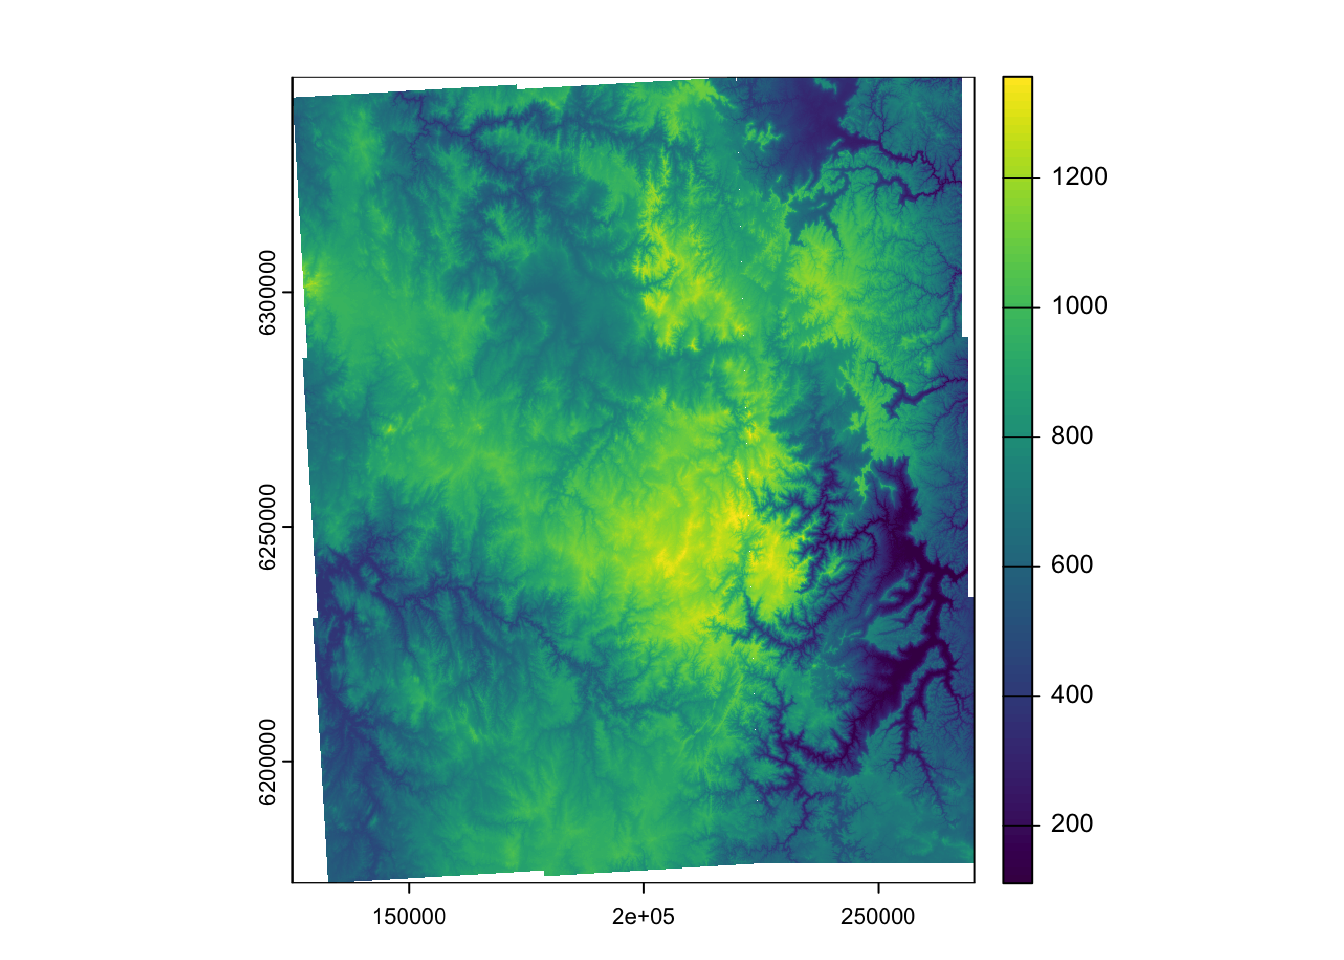
Viewshed calculations rely on a digital elevation model (DEMs). These are maps of the elevation of the Earth’s surface, usually created from satellite LiDAR (light detection and ranging) sensor data or related techniques. The elevation (that is, height above sea level) data they contain is typically accurate to around +/- 1m or less, and they are available for various spatial resolutions from 1 metre by 1 metre patches (pixels) up. For all the calculations here, we are using the 5 metre by 5 meter resolution DEMs provided by the NSW government, freely available from the NSW Spatial Information web portal. DEM files for Oberon and the eight regions surrounding it were downloaded and used for these blog posts. These DEMS were then stitched together to form a larger DEM, comprising the DEMS for the following regions: Wallerawang, Orange, Bathurst, Blayney, Oberon, Crookwell, Katoomba, Taralga, Burragorang.
The resulting DEM, viewed as a two-dimensional plot, looks like this:
Unless you are familiar with the geography, such 2D elevation maps can be difficult to interpret. Plotting them in 3D makes them more accessible – below is part of the Oberon-and-environs DEM visualised in three dimensions, with the proposed Palings Yard wind farm turbines shown as icons. Better icons are needed, but these icons are in the correct positions and are to-scale – that is, they accurately reflect the size of likely wind turbines in the landscape (in this case they are scaled to represent wind turbines which are 240 metres all at the top of the blade span).
In these animations the blue line represents the existing 500kVA transmission line (not fully shown), the whites lines are Abercrombie, Shooters Hill and Edith Rds, and the red shaded area is the exploration area for the proposed Pines wind farm.
Note
Creating these 3D animated maps will be the subject of a later blog post.
Line-of-sight calculations
Using these DEMs, a viewshed from any point on the map can be calculated by determining whether the intervening terrain will obstruct the line-of-sight from a view point to any other point on the map. The height of the view point can be specified and added to the terrain elevation at its location. Similarly, the points being viewed in the landscape can be set at a height above the terrain elevation at each point. Since we are interested in reverse viewsheds, we set the view point elevation at the relevant height of the structure of interest, such as a wind turbine, and the observation elevation at 1.5m above the terrain elevation, since that is an average eye level.
Of course, this is a simplified model because it only uses bare-earth elevations – that is, the heights of vegetation or intervening buildings are not included in the calculations. As such, the viewsheds calculated are worst-case, and trees etc may reduce the extent of actual viewsheds. However, NSW government guidelines state that bare-earth elevations should be used in visual impact assessments, precisely because they are worst-case. In fact, adding in land cover elevation information dramatically complicates the computations required, for reasons we won’t cover here. As it is, the viewshed computations potentially involve billions of calculations. Fortunately, efficient algorithms have been developed to make such computations feasible even on laptop computers, although they can still take many hours to complete.
The Earth is not flat…
Reality is more complicated than what is described above. Apart from trees and other ground cover, two other factors need to be taken into account when calculating viewsheds: the curvature of the Earth, and refraction of light by the atmosphere. The Earth curvature issue is intuitively obvious – if we look towards the horizon, the surface of the Earth falls away and thus the horizon is a finite distance away – in fact, on a clear day you cannot see forever! Another issue is that due to the Earth’s curvature, as we look towards the horizon (that is, approximately at a tangent to the Earth’s surface), our gaze transects increasingly higher altitudes, with thinner and thinner air. This reduction in air density creates a refraction lens effect which partially counteracts the effect of the curvature of the Earth on a viewshed, as shown in the diagram below.
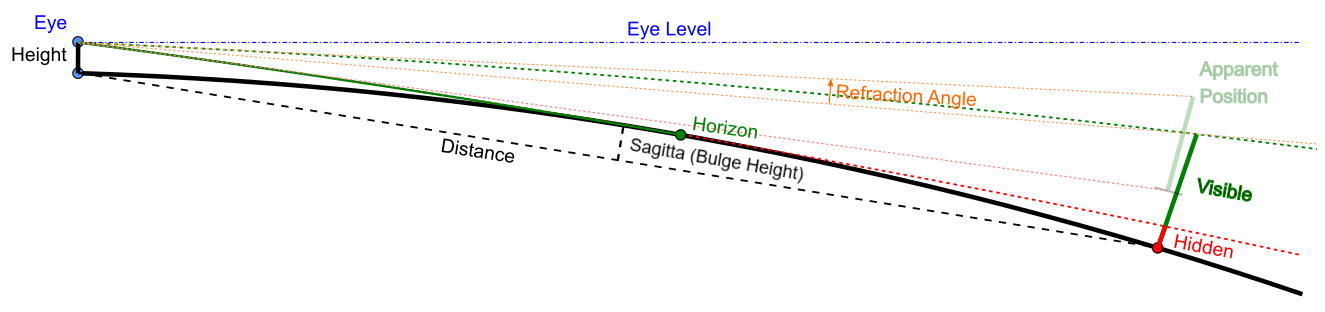 Source: Walter Bislins Advanced Earth Curvature Calculator
The viewshed calculation software we have used takes both of these factors into account using a simple but quite adequate correction mechanism. So let’s look at a viewshed with and without such correction.
Illustrating the effect of Earth curvature and atmospheric refraction correction in viewshed calculations
The map below shows the calculated viewshed for just one of the wind turbines proposed for the Palings Yard wind farm, south of Oberon. The viewshed is for a blade tip at 170.5m elevation, as used in the aforementioned paper by Palmer.
By toggling on and off the two viewshed layers on the map, you can compare the results with the Earth curvature and atmospheric refraction correction disabled, and with it enabled using the widely-accepted compensation co-efficient of 0.85714.
It is easy to see that without the correction, the calculated viewshed is quite a bit larger because the curvature of the Earth is ignored (noting that refraction by the atmosphere counteracts the effects of curvature, but only partially).
Viewshed shaded by distance from turbine
Although a simple binary (all-or-nothing) viewshed is useful, it fails to take into account distance. Obviously, the further away you are from an object, the smaller it appears. Also, atmospheric conditions such as haze from smoke or dust (or even pollen) can reduce visibility of objects at larger distances (and fog will reduce visibility at even short distances). However, atmospheric conditions are variable and we don’t take them into account in our clculations – again, we assume a worst case of perfectly clear air. But the effcet of distance can be taken into account.
Below is a map of the viewshed as above (with curvature and refraction corrections enabled), but shaded by distance from the hypothetical wind turbine, to de-emphasise distant viewpoints. This is a first, small step towards better representation of visual impact.
Viewshed shaded by distance bands from turbine
The continuous distance shading shown above is pretty, but it may be more useful to categorise distance into bands. This is typically done in visual impact assessments.
Below is the same viewshed as above (with curvature and refraction corrections), but this time shaded by distance categorised into bands as suggested by James F. Palmer in the paper mentioned above – however for illustrative purposes we have extended the bands to 64.4 km (the bands suggested by Palmer stop at 32.2km, which is probably reasonable).
Viewshed distance bands as separate layers
Finally, we can create a variation on the map above in which each distance zone is represented as a separate layer which can be toggled on and off. This may not be particularly useful but was done to work out whether it was possible with the software we are using (see below).
Software
All computation for these blog posts was carried out using the free, open-source R system for statistical computing. In particular, the terra package, which embeds high-performance C++ code from the popular GDAL library for geospatial raster processing in R was used, together with the sf and leaflet packages for other GIS functions and interactive map rendering, respectively.
The source code for this blog post, which contains all the code used to create it, can be found on Github.
Next steps
In the next in this series of blog posts we will look at the calculation of compound viewsheds – that is, the viewshed for a collection of wind turbines, not just a single one.
References
Palmer, James F. 2022. “Deconstructing Viewshed Analysis Makes It Possible to Construct a Useful Visual Impact Map for Wind Projects.” Landscape and Urban Planning 225 (104423). https://doi.org/10.1016/j.landurbplan.2022.104423.
Citation
BibTeX citation:
@online{churches2024,
author = {Churches, Tim},
title = {Wind Farm Visual Impact Assessment -\/- Part 1},
date = {2024-09-16},
url = {https://oberon-citizen.science/posts/2024-09-16-wind-farm-visual-impact-assessment-part-1/},
langid = {en}
}
For attribution, please cite this work as:
Churches, Tim. 2024. “Wind Farm Visual Impact Assessment -- Part
1.” September 16, 2024. https://oberon-citizen.science/posts/2024-09-16-wind-farm-visual-impact-assessment-part-1/.