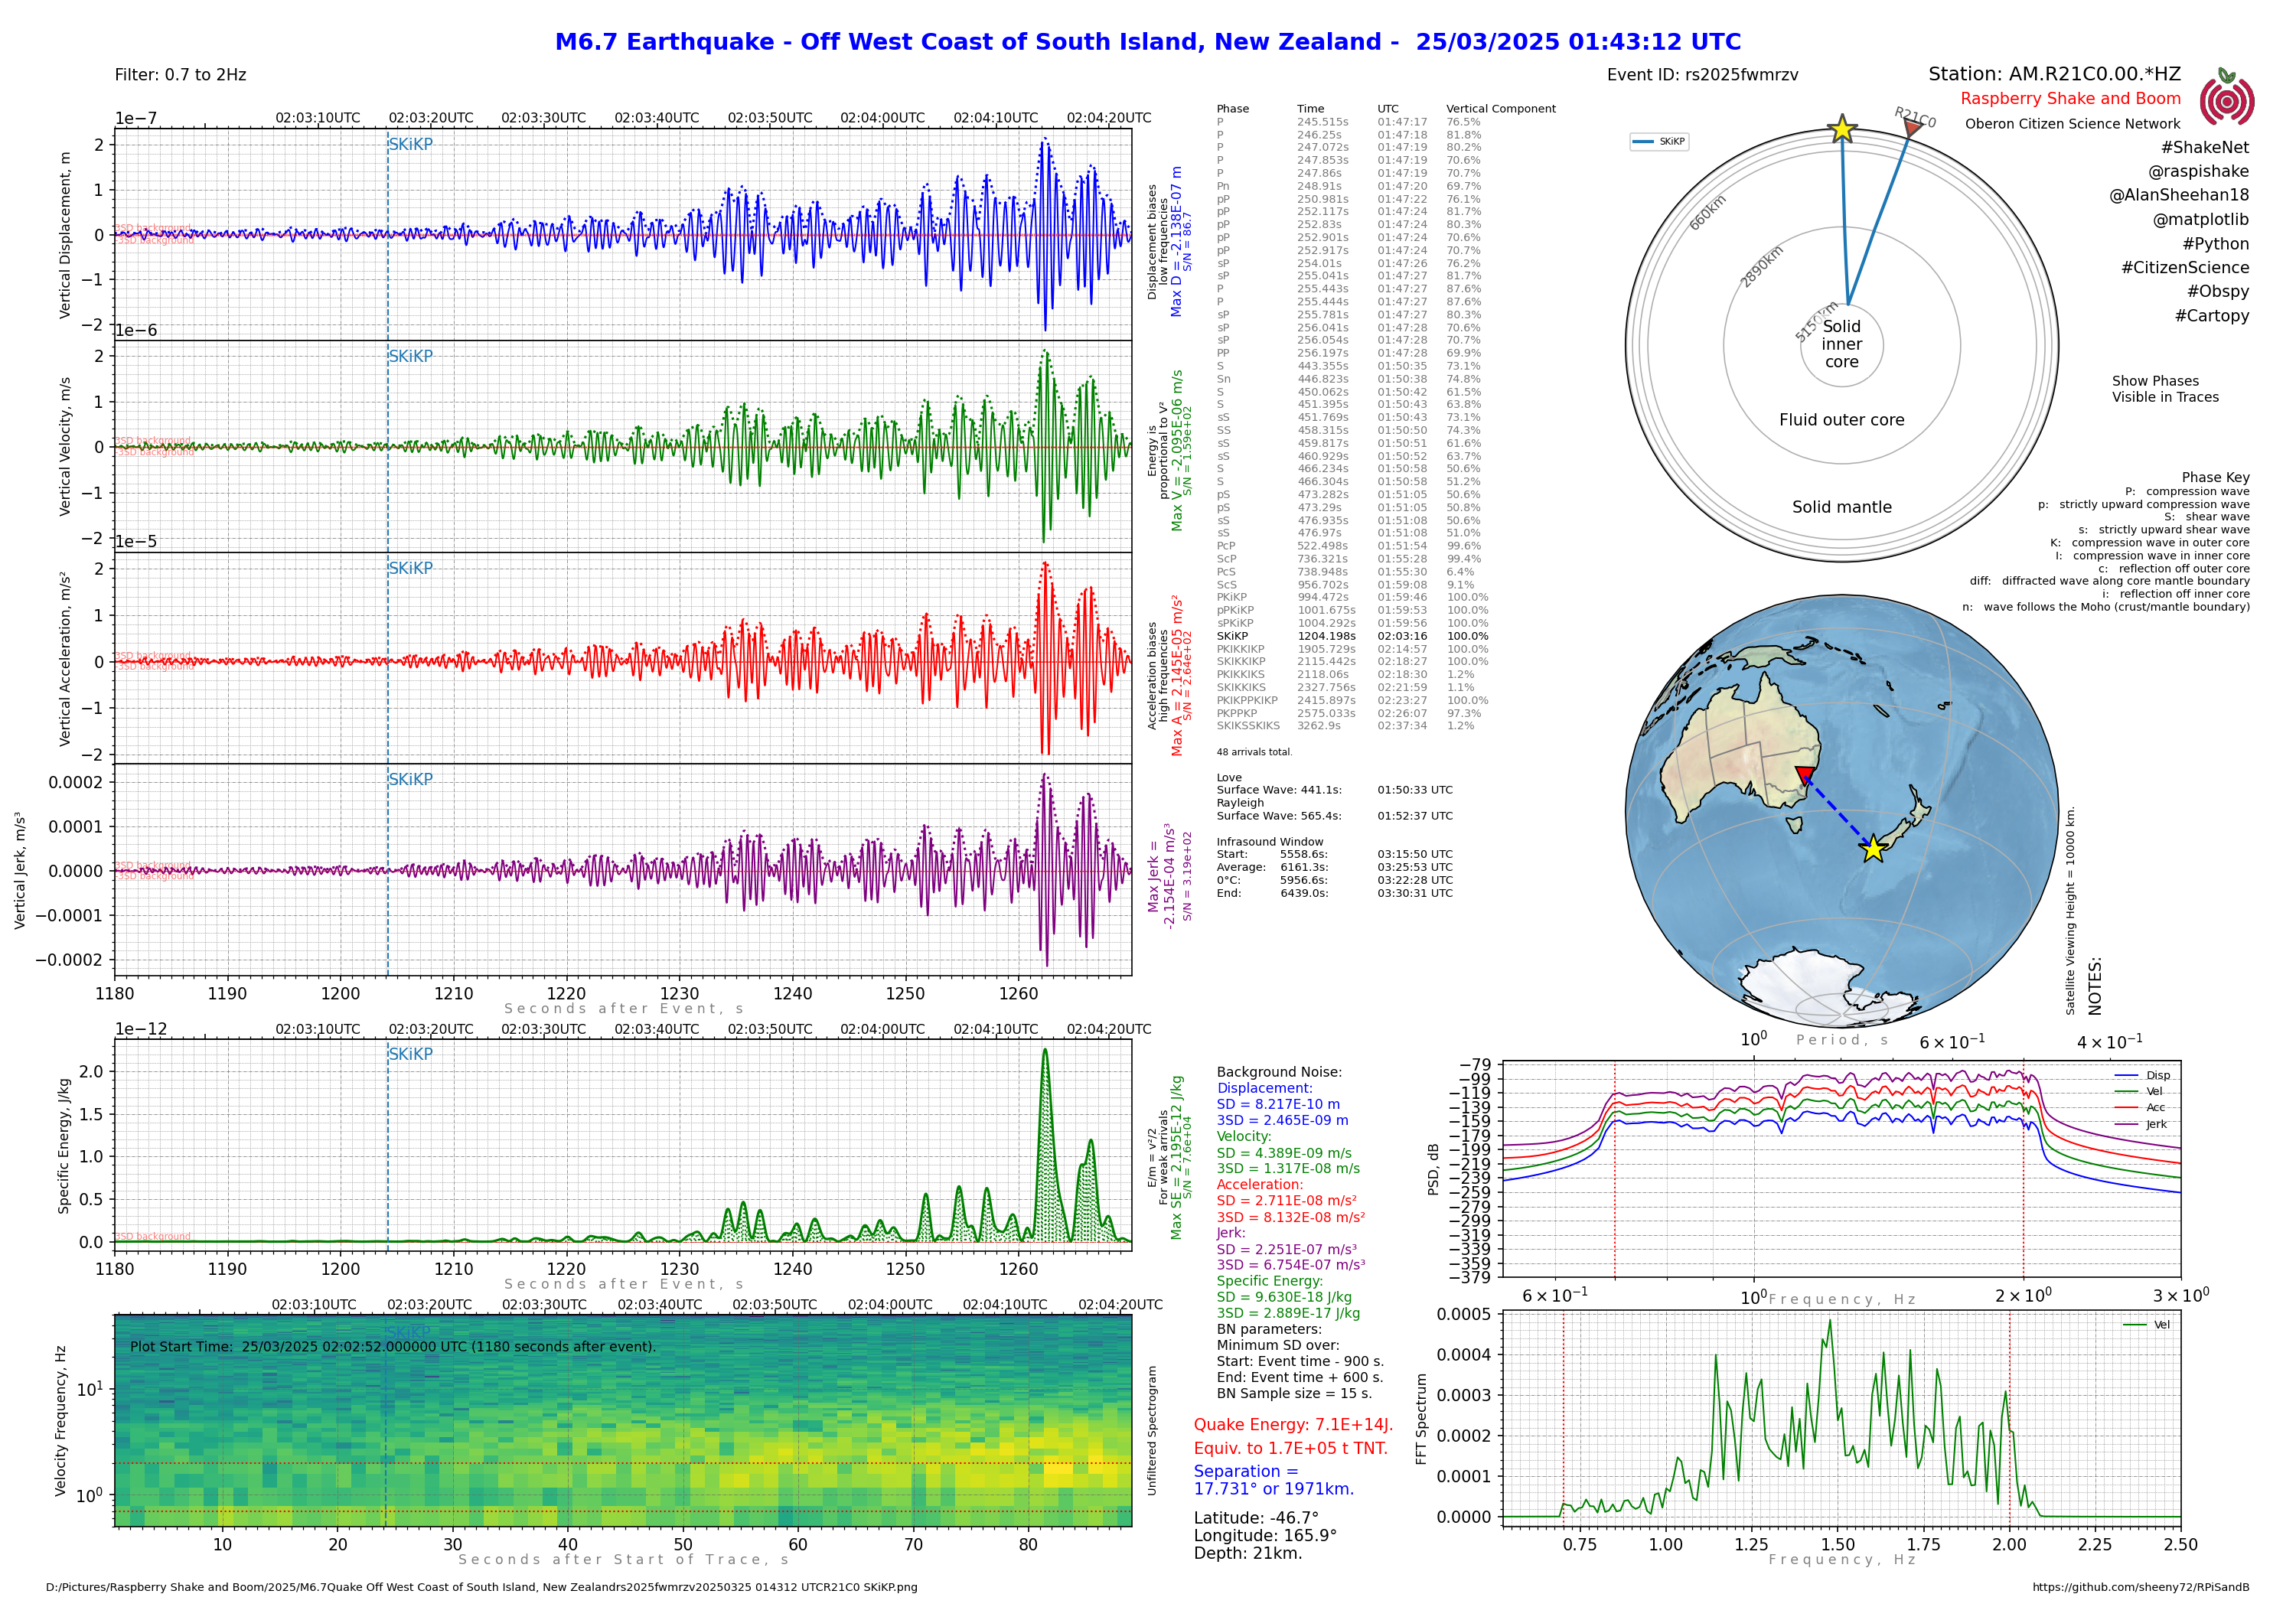
A large magnitude 6.7 (M6.7) Earthquake occurred off the southern coast of New Zealand on 25th March, 2025 at 01:43:12 UTC (2:43pm local time).
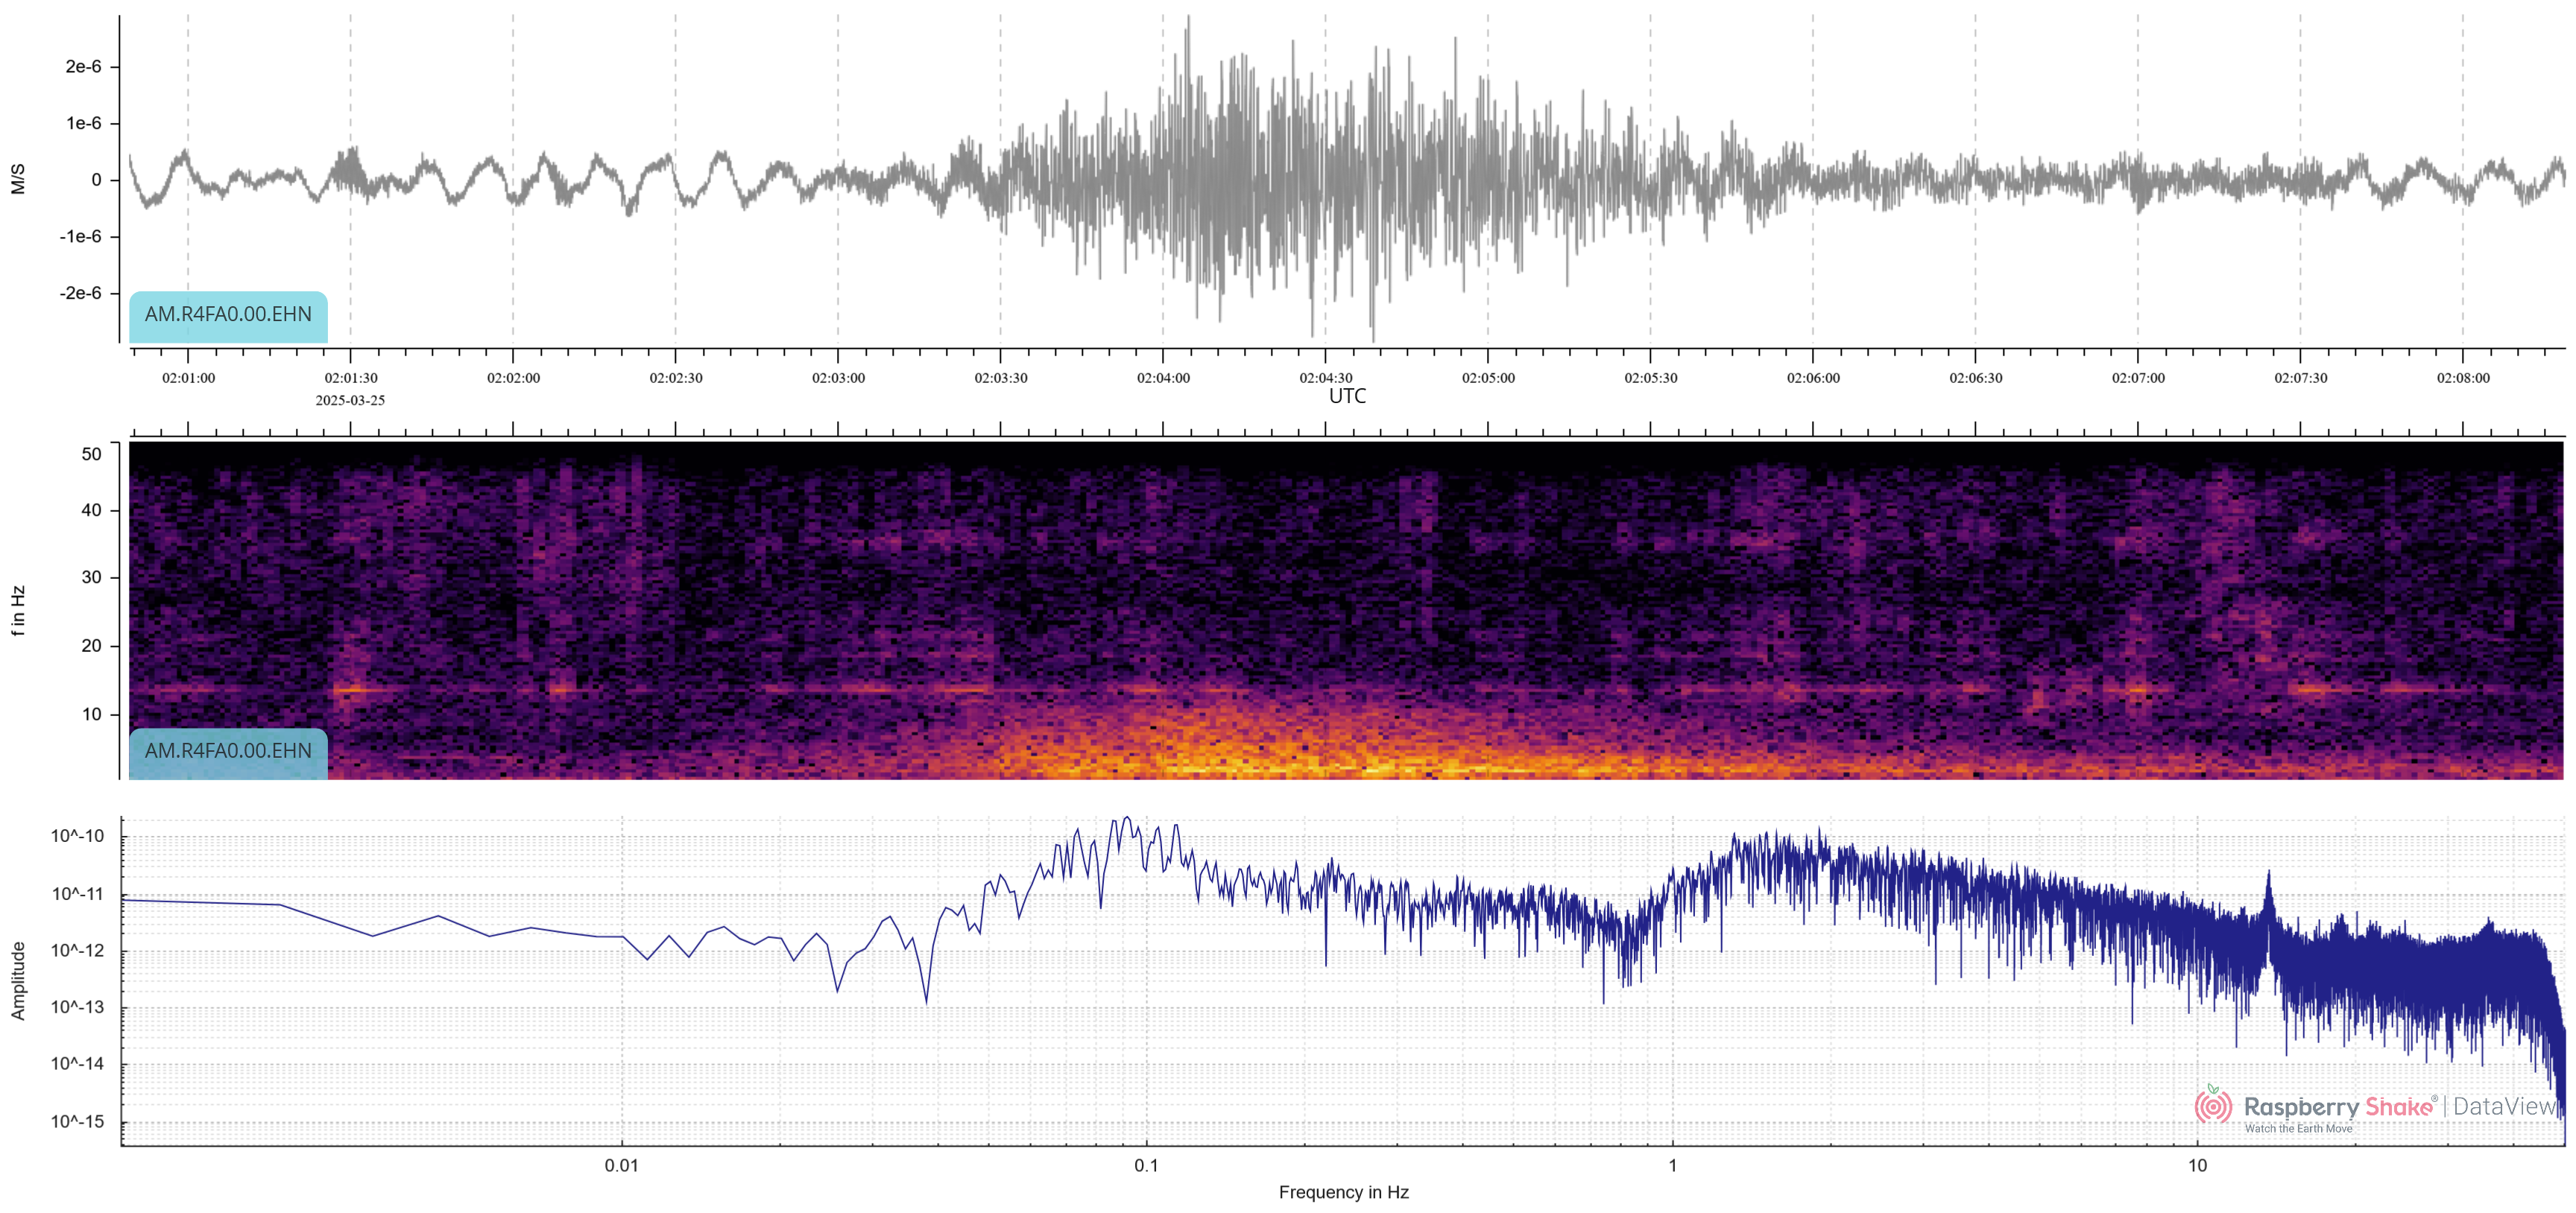
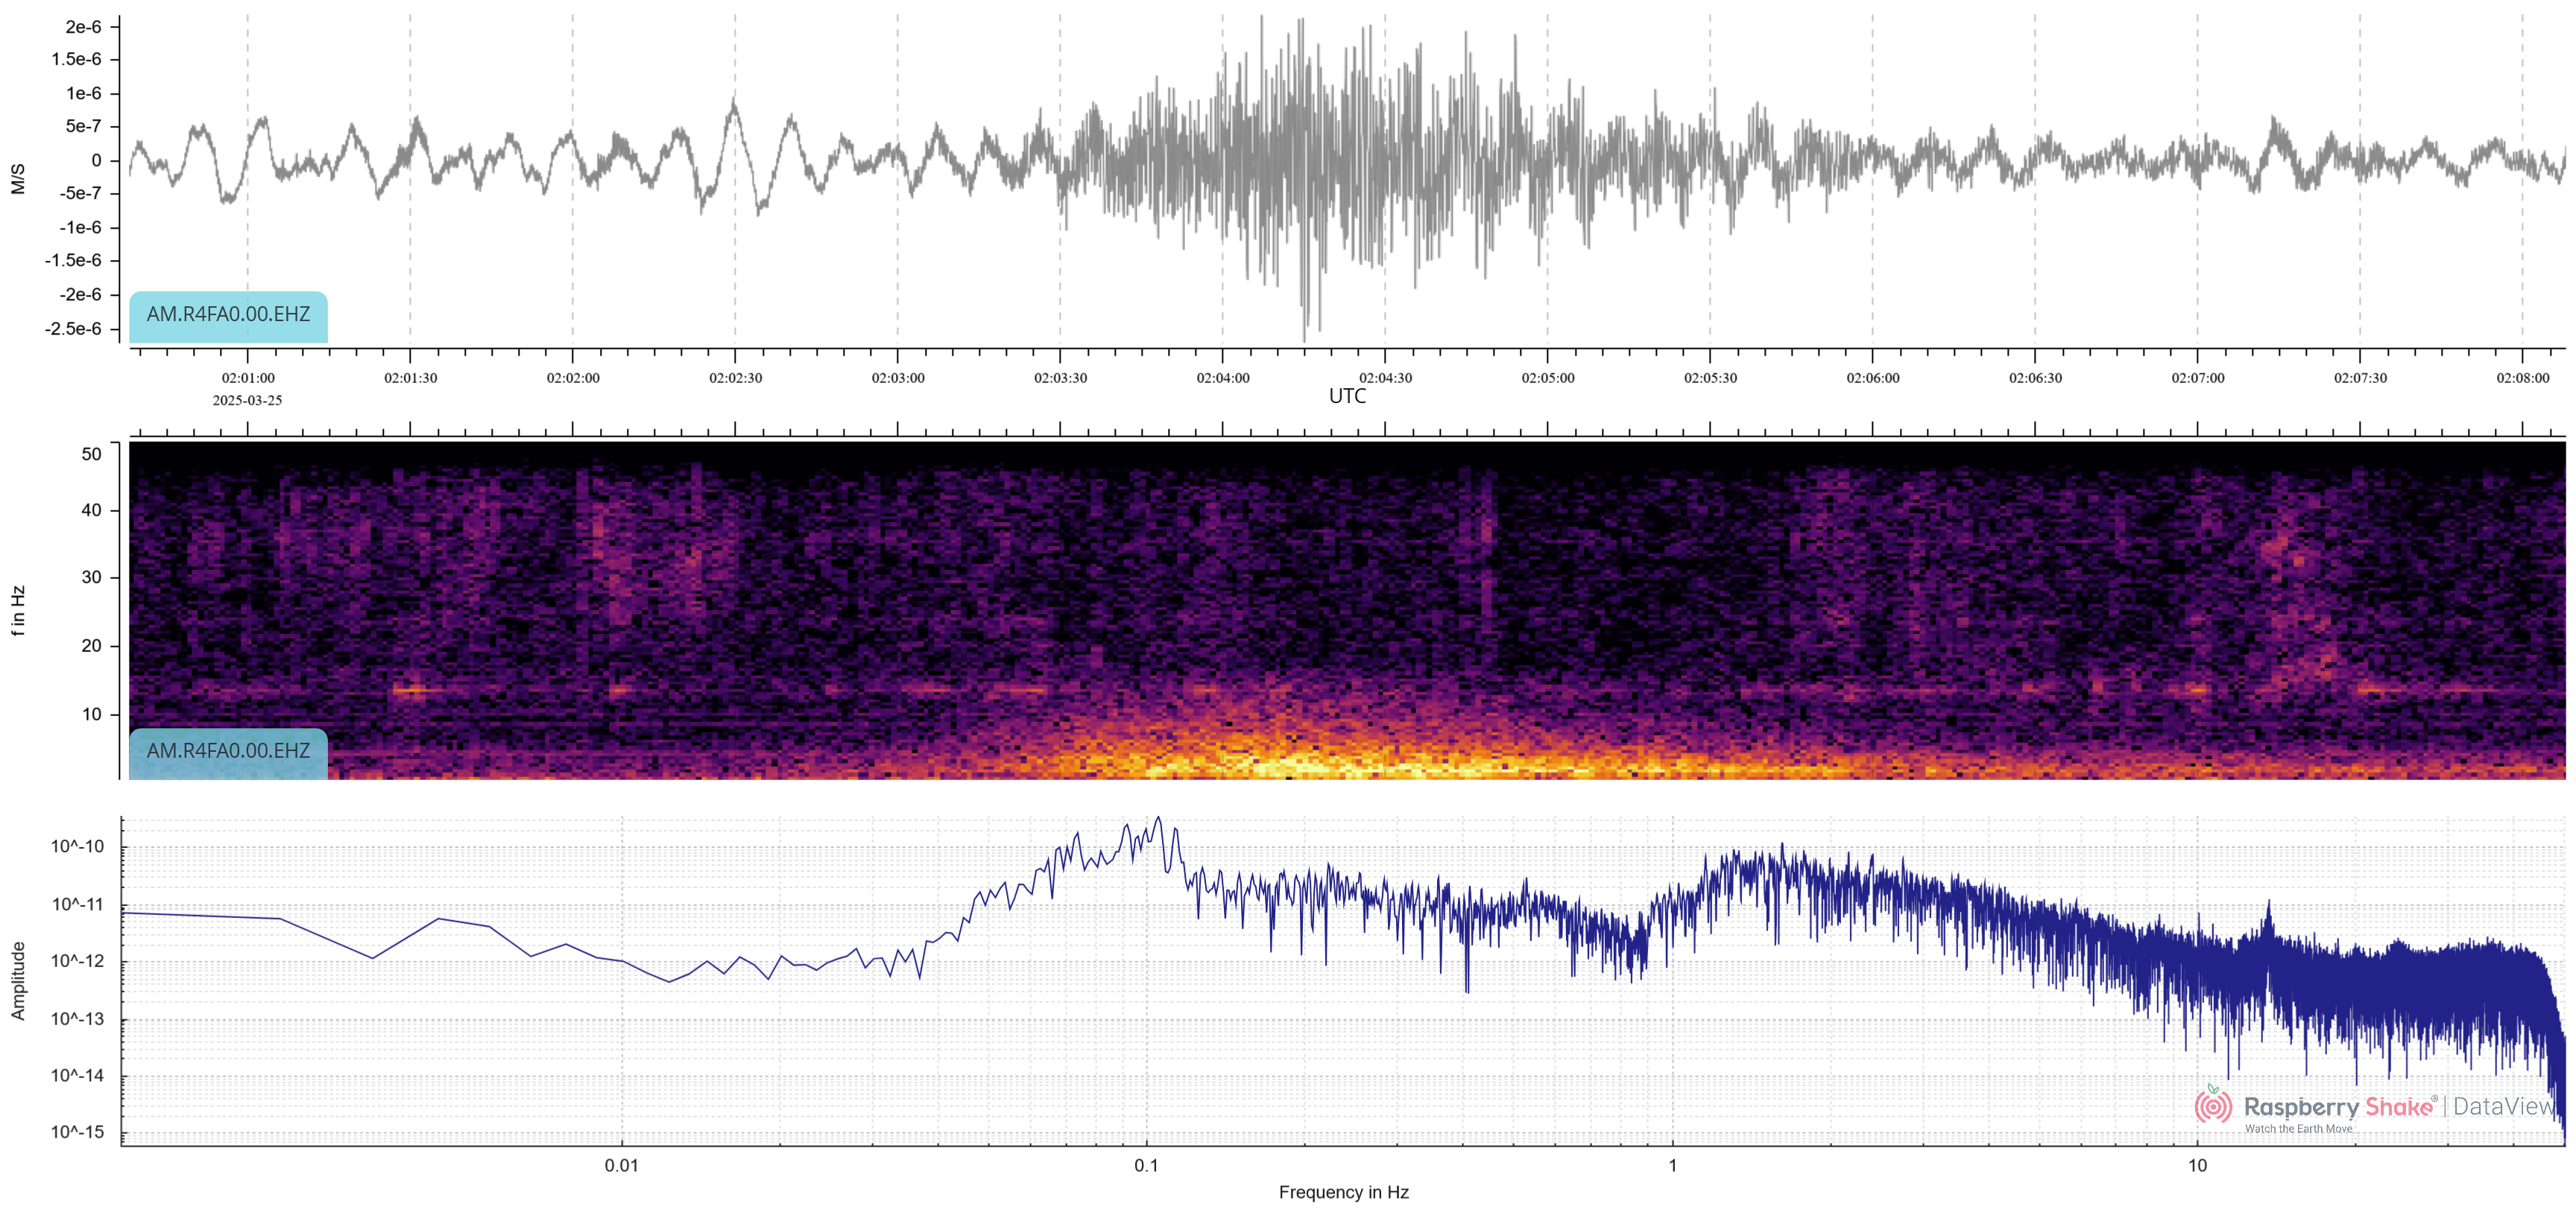
While processing phase arrivals on Oberon Citizen Science Network station R21C0, a large signal was noticed that dwarfed the expected signal. The SKiKP phase arrival was undetectable due to this large seismic signal or noise. It lacked low frequencies, so initial thoughts were it was local noise and probably not a seismic signal of any interest, though I’d never seen a signal like this before - noise or otherwise.
That changed when I checked Oberon Citizen Science Network station R5968, which is 6 kms away, and found the same signal/noise. This is not just local to one station, and thus unlikely to be just noise. How far does it go?
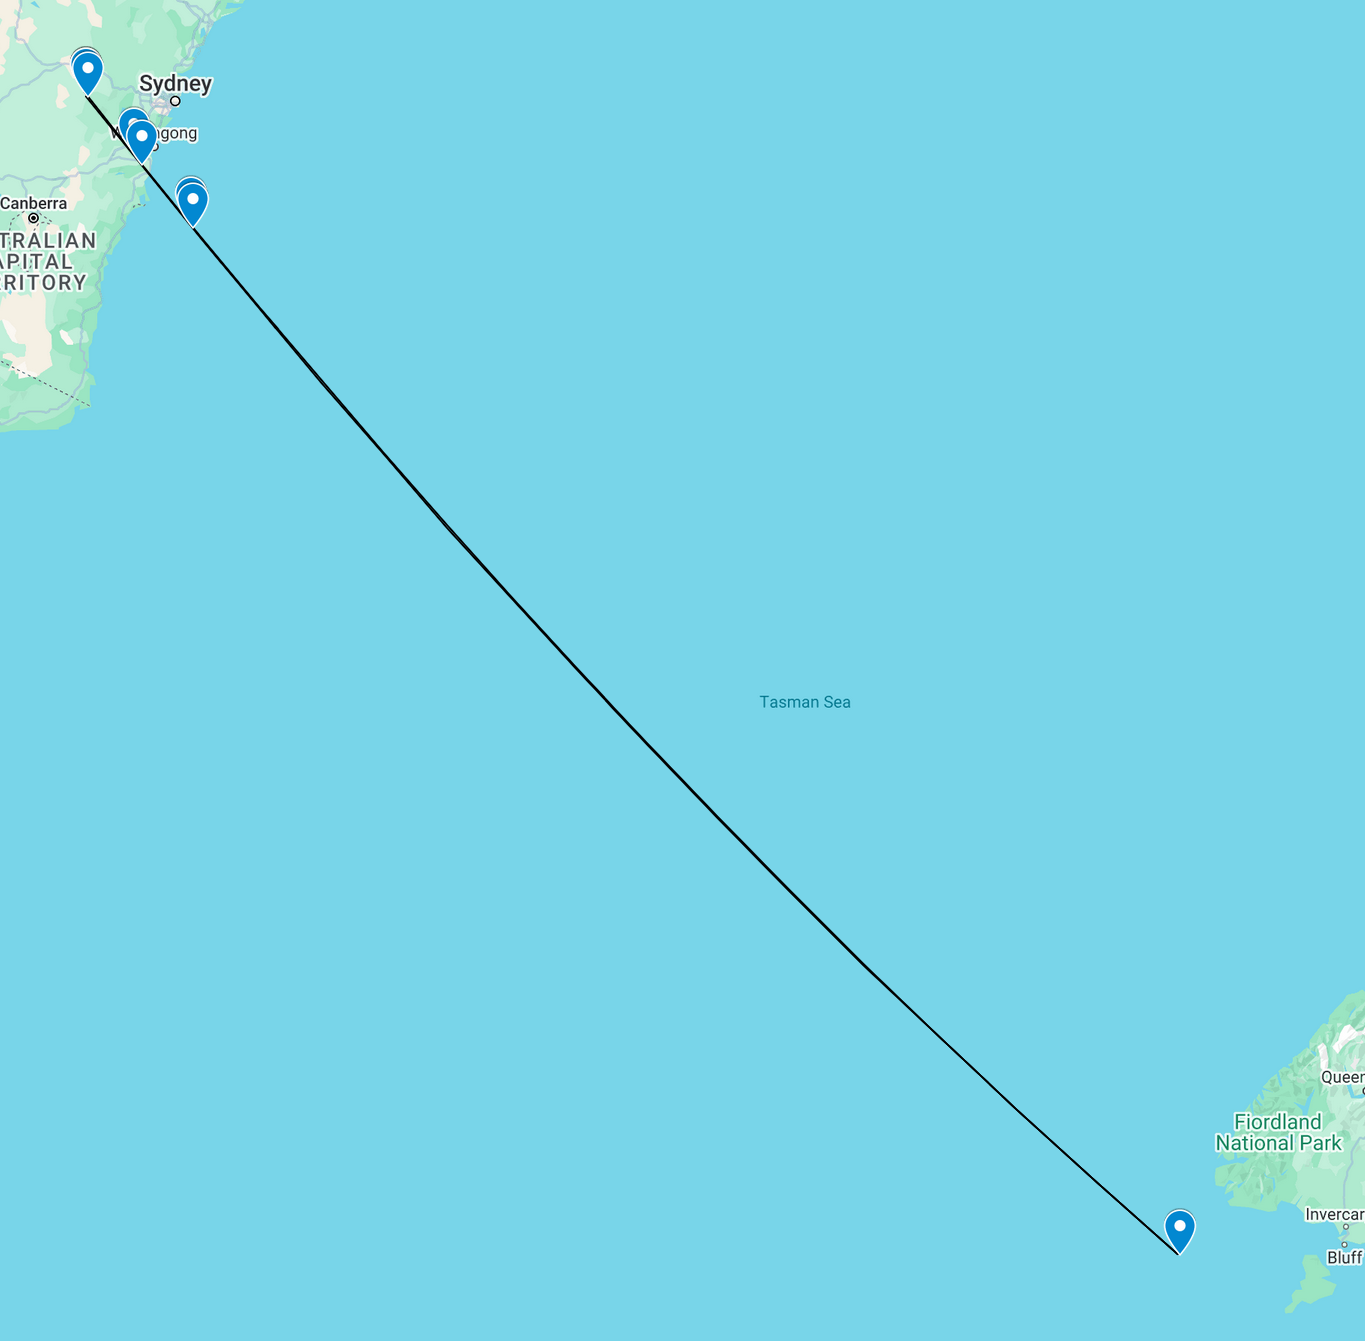
So a search was done of Raspberry Shake Stations in Lithgow, Mudgee, Gulgong and Coonabarabran… The signal was on all of them! It seemed to be slightly later as the stations went north, but that was difficult to be sure since the signal has no sudden changes in amplitude to give accurate timing.
The arrival time was too late for either Love or Raleigh surface waves, so the HDF channels of the Raspberry Shake and Booms were checked to see if it was an infrasound signal moving the ground and generating a seismic signal. We had detected this type of interaction in the past when analysing very close blasts from Oberon Quarries. However there was no corresponding infrasound signal.
The Raspberry Shake Organisation have a Discord Server with a channel for “Whats that wiggle?” - a place where you can post weird signals either to show or to find out what they might be. A few screen shots were posted to see if anyone could shed any light on what the signal might be.
Giuseppe Petricca from Raspberry Shake made a throw away comment that it reminded him of the infrasound arrival in Scotland of the Hunga Tonga-Hunga Ha’apai eruption in Tonga in 2022. I already knew it wasn’t infrasound - at least atmospheric infrasound - but the seed was sown… what if it was underwater infrasound from the quake stimulating a seismic signal? We’ve detected atmospheric infrasound doing just that - why not water?
It was late and so the calculations had to wait till the next morning.
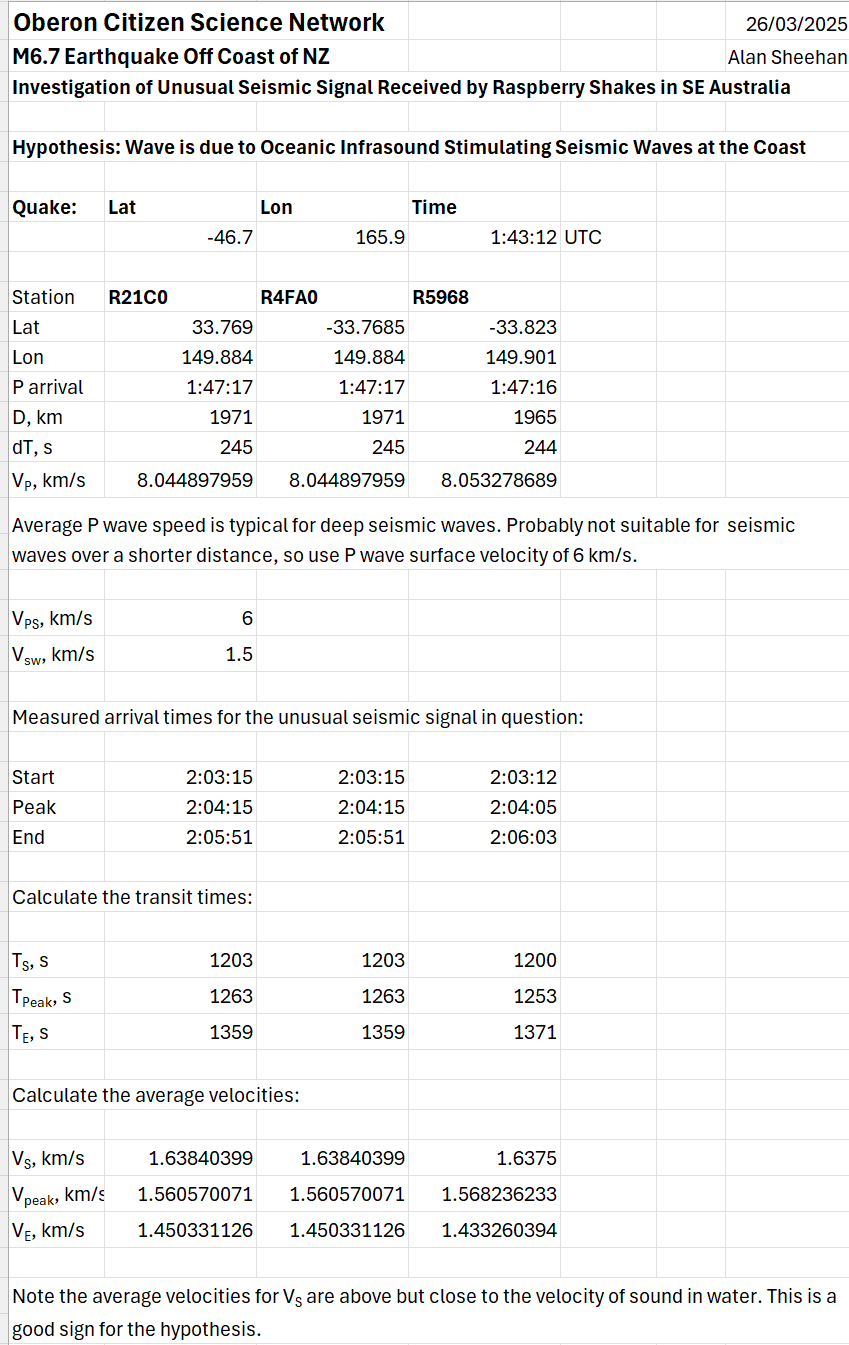
The hypothesis was that infrasound from the quake travelled through the ocean until it reached the shore and then the pressure waves of the infrasound became seismic waves which we detected. We knew the positions of the Raspberry Shake & Boom stations and the quake, the distance between them, the speed of P waves at the surface of the earth (6 km/s) and the speed of sound in water (1.5 km/s). This suggested two ways of testing the hypothesis.
Test 1: calculate the average speed of the start of the detected wave. This should be the wave along the shortest path from the quake to the station. If the average speed is less than the speed of sound in water, the hypothesis is wrong.
The calculations confirmed the hypothesis so far.
Test 2: by solving simultaneous equations, the point where this first oceanic infrasound wave turns to seismic should be able to be calculated. If the point is on the coast, the hypothesis is confirmed.
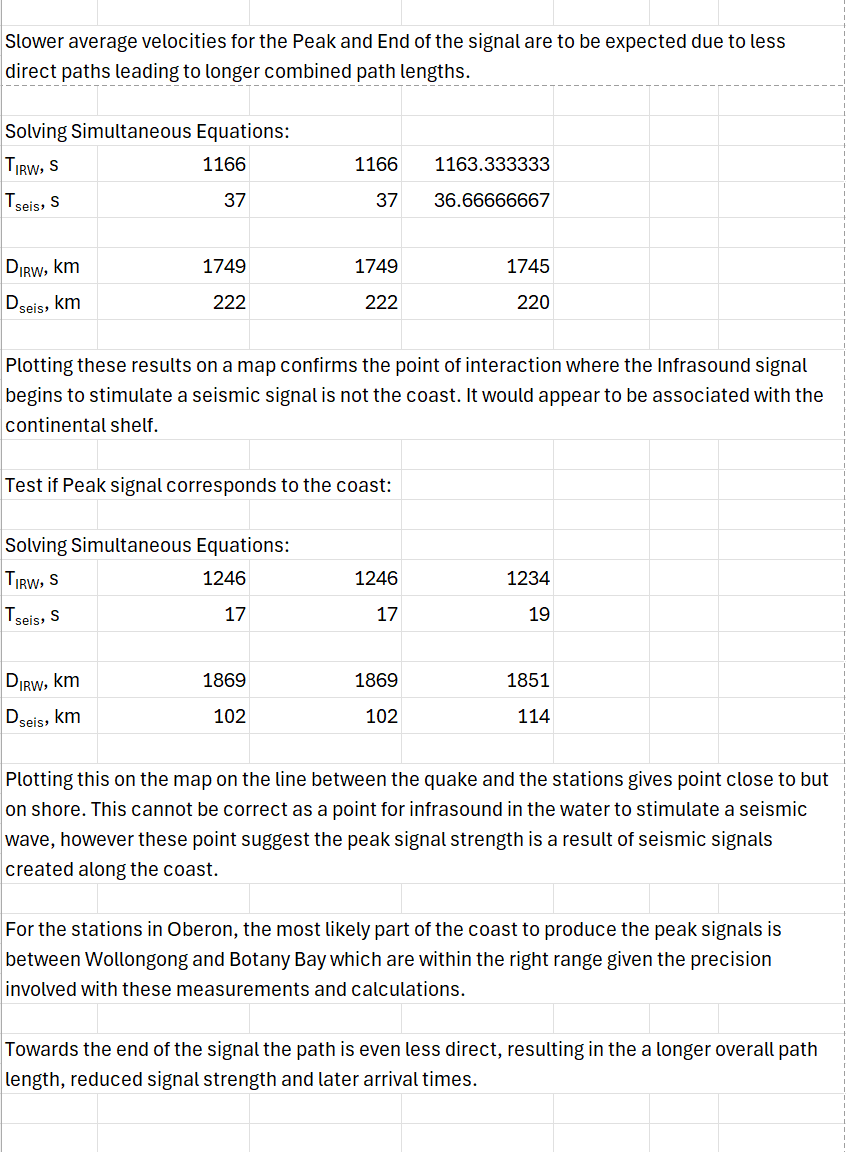
The calculations put the point off the coast, so the hypothesis was wrong. The infrasound doesn’t stimulate a seismic wave AT the coast.
A minor adjustment to the hypothesis suggested itself. The initial point of interaction is probably the continental shelf, and it’s likely that interaction continues from there until the coast.
In a similar way, the point of interaction corresponding to the peak signal strength was calculated. Is this on the coast?
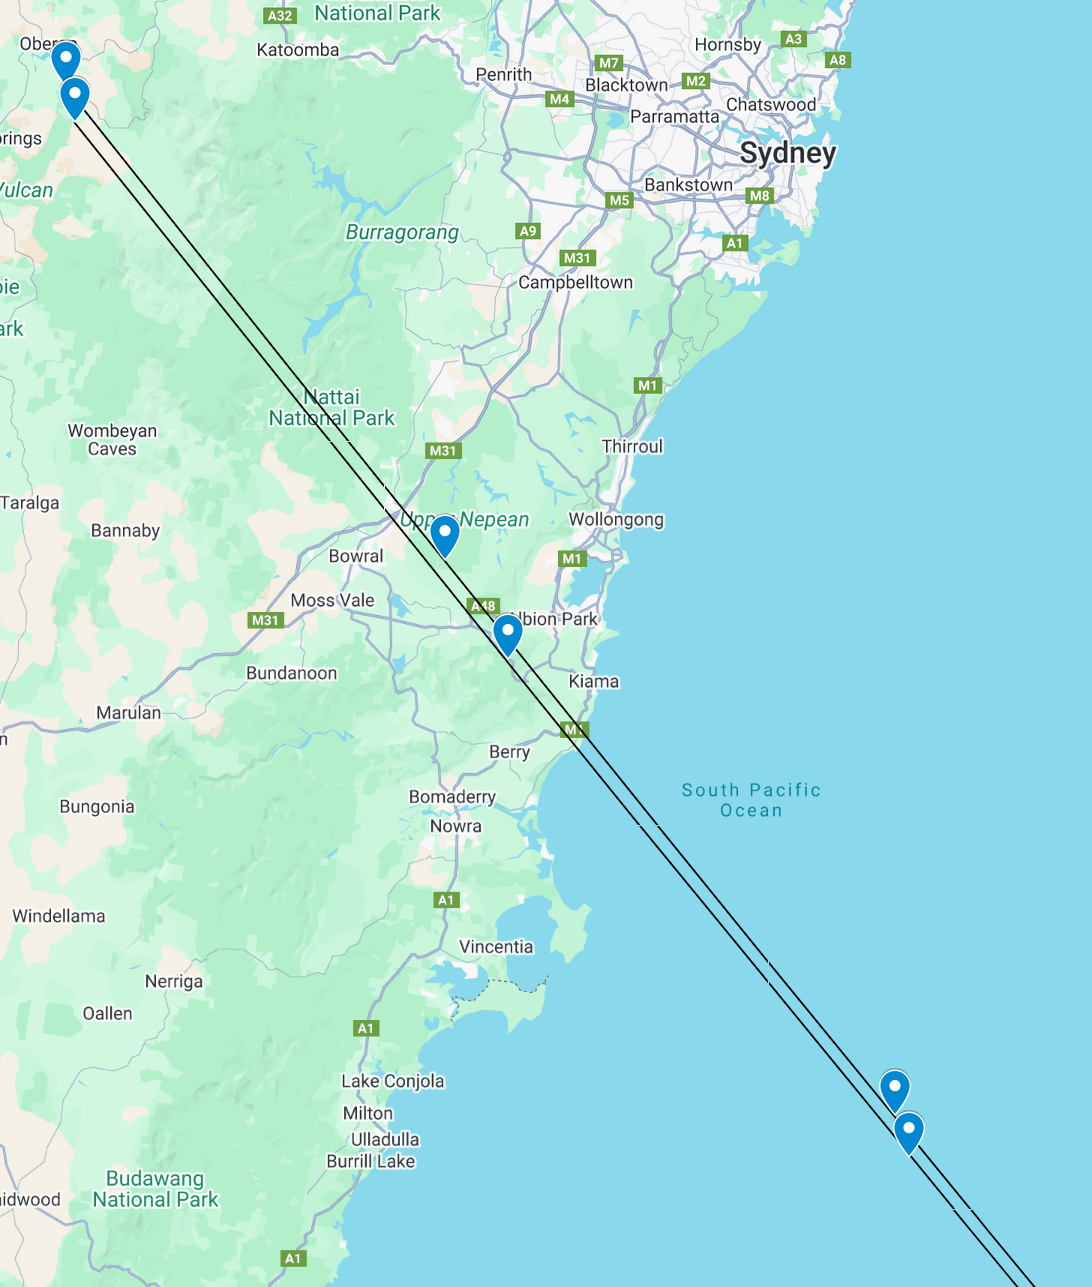
Plotted on the map this point of second interaction is inland some way, but that is assuming that the point is constrained to the direct line between the quake and station, which it isn’t. The point of interaction corresponding with peak signal amplitude probably coincides with the coast between Wollongong and Botany Bay.
Click or tap on these margin figures to see a larger version.
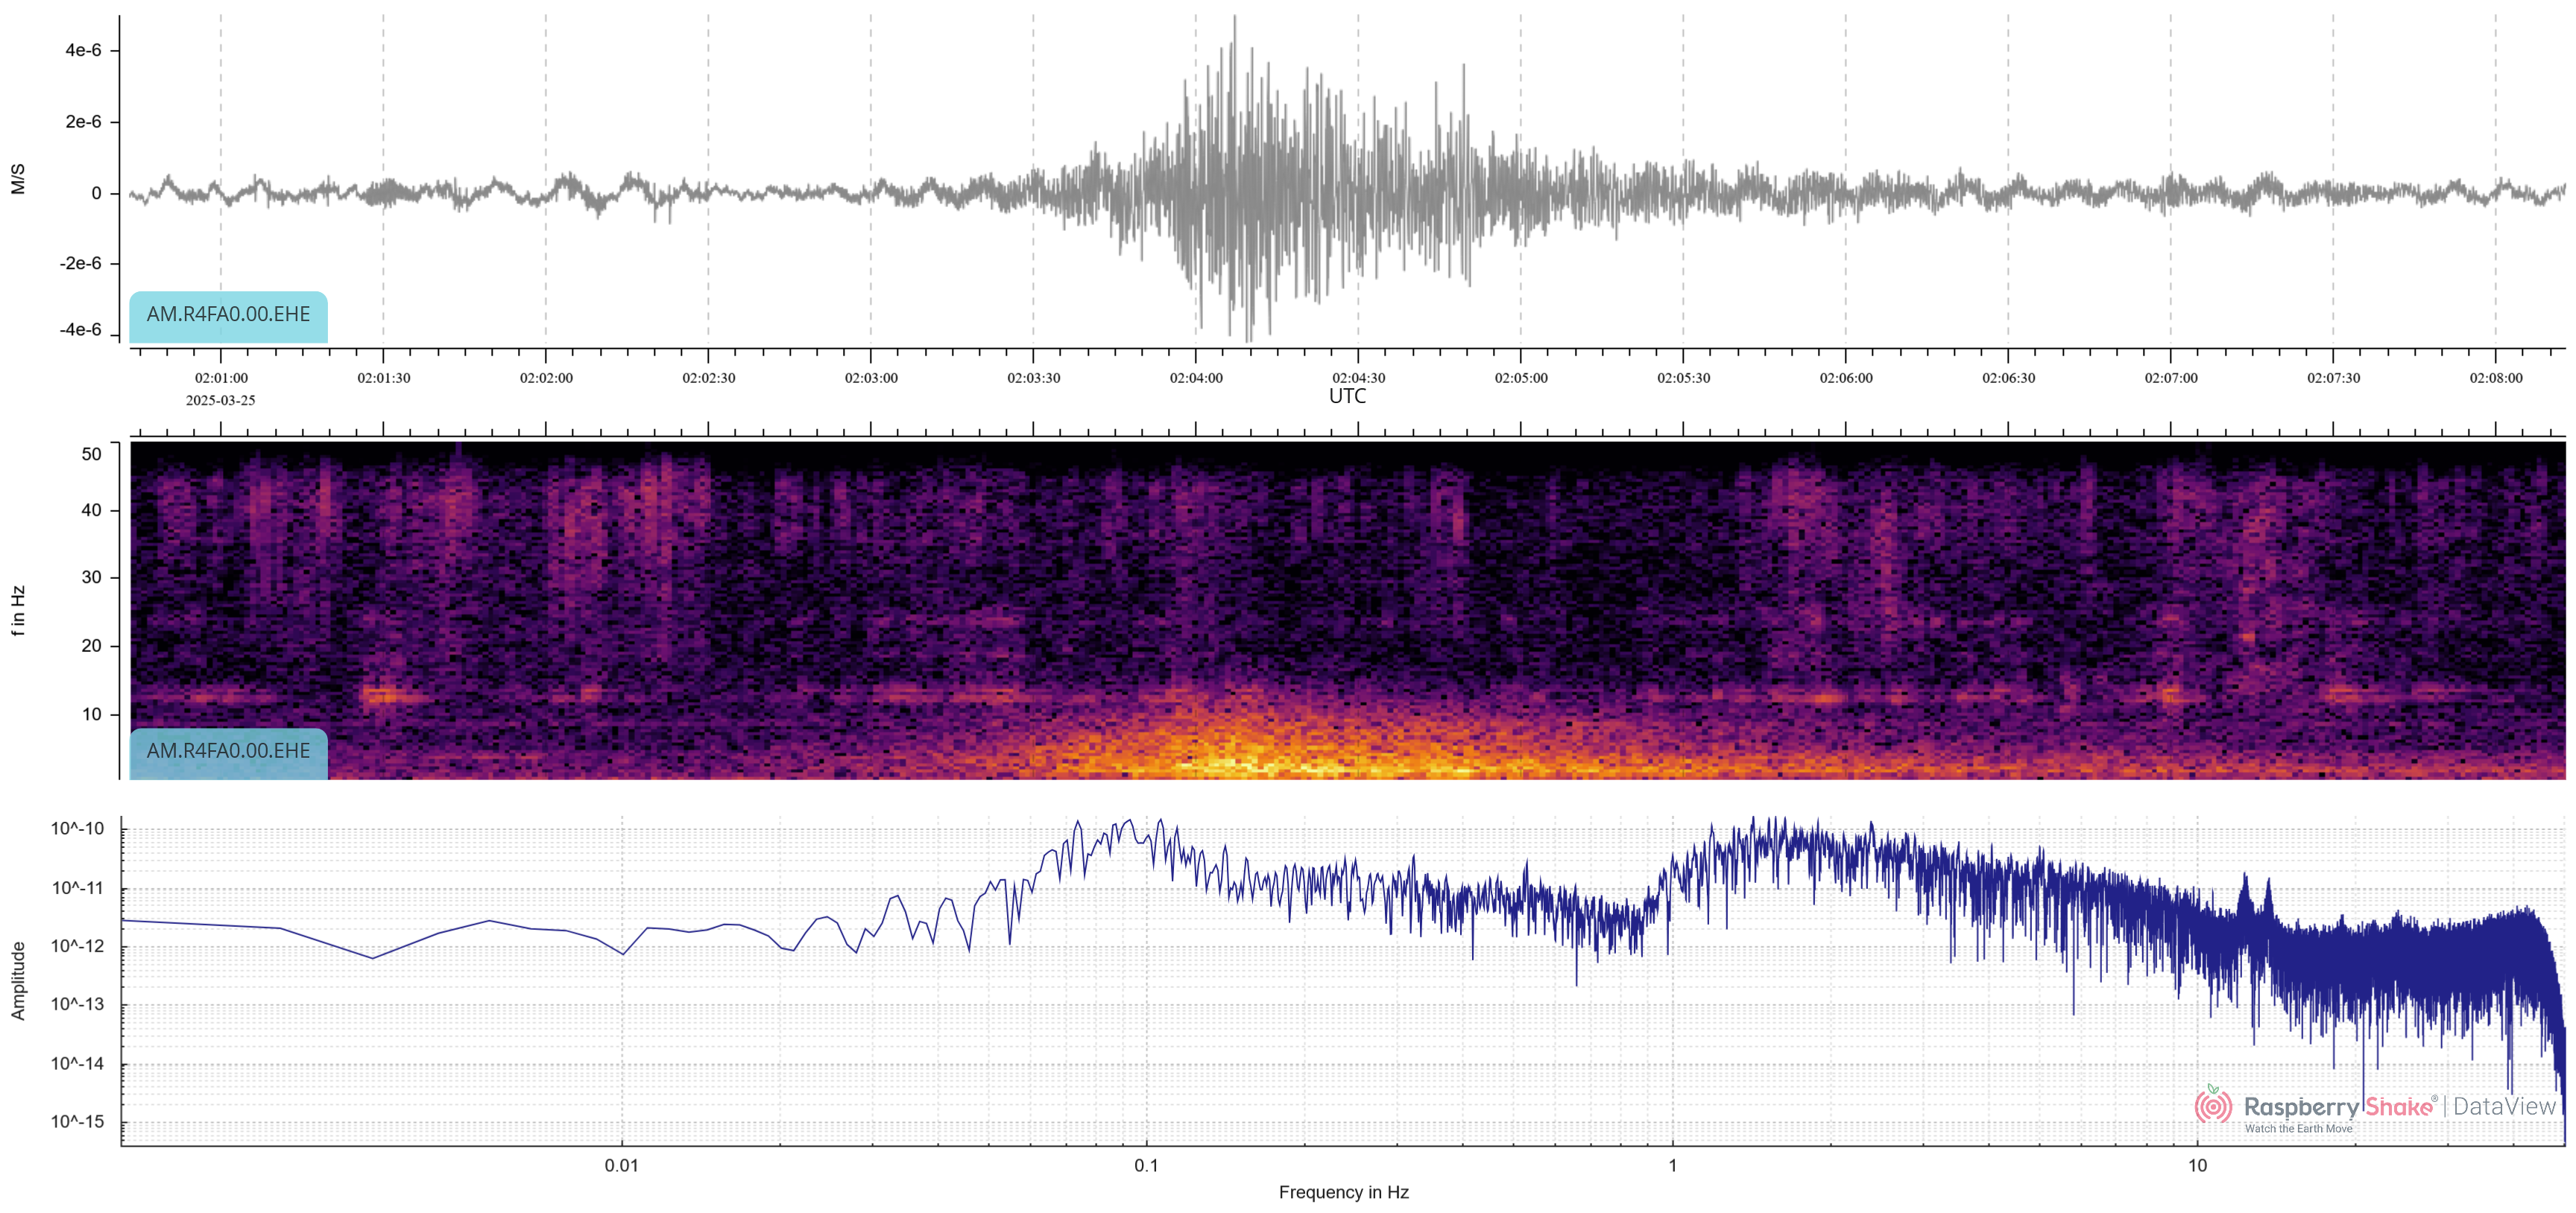
One more observation: the peak amplitude of EHE channel of R4FA0 is about twice that of the EHN channel. This is consistent with the peak point of interaction being on the coast between Wollongong and Botany Bay. If EHN and EHE were equal, the wave would be approaching from 135° or closer to the direct path.
This section of coast is close to the correct distances from both station and quake, and is roughly perpendicular to the approaching infrasound waves - perfect for generating a strong seismic signal.
The tail end of the signal is likely to be waves that have taken a less direct route between quake and station, so the paths may be significantly longer (but unknown in length) so the average speed of these waves appears less than the speed of sound in water. If the true length of these paths was known, their average speeds would be above the speed of sound in water.
Calculation details
Addendum September 26, 2025
Since posting this blog we have learned that these waves are known as T waves. Many thanks to Colin Lynam for his help and information.
As T waves consist of an infrasonic wave (in the ocean) followed by a seismic wave, the prediction of a T wave arrival time is problematic as the path lengths through both the ocean and the crust are not known and fixed.
Some characteristics of the T waves are of interest though.
Attenuation of high frequencies is less in sea water than in rock, so T waves can provide a clues to the high frequency nature of an earthquake more so than the direct seismic waves.
Interestingly, attenuation below about 2.5Hz is increased in the marine infrasonic waves, so this characteristic helps to identify a T wave when it is received.
References and Links
https://www.sciencedirect.com/science/article/abs/pii/S006526870749001X
https://www.earth.northwestern.edu/people/emile/PDF/EAO169.pdf
Citation
@online{sheehan2025,
  author = {Sheehan, Alan},
  title = {Oceanic {Infrasound-stimulated} Seismic Wave - {T} {Wave}},
  date = {2025-03-30},
  url = {https://oberon-citizen.science/posts/2025-03-3-oceanic-infrasound/},
  langid = {en}
}

